THE CHALLENGE
Large projects in construction have 10,000 project photos, 1000s of issues that need tracking during construction. Issues are tracked in Excel spreadsheets, the workflow is complex and time consuming. It is hard to keep on top of all of the information and critical information gets lost which costs time and money later on.
The opportunity is to provide a better way of visualising & interacting with information about problems in construction, assisting site managers in their day to day work a the site.
______________________________________
THE PROCESS
Step 1: Create a future vision of the product and extract a scope for an MVP test with end users. For that I was a core contributor in facilitating a creative workshop with the client. Goals were to a) map out a set of present, future and required features, b) to find innovative solutions to UI challenges.
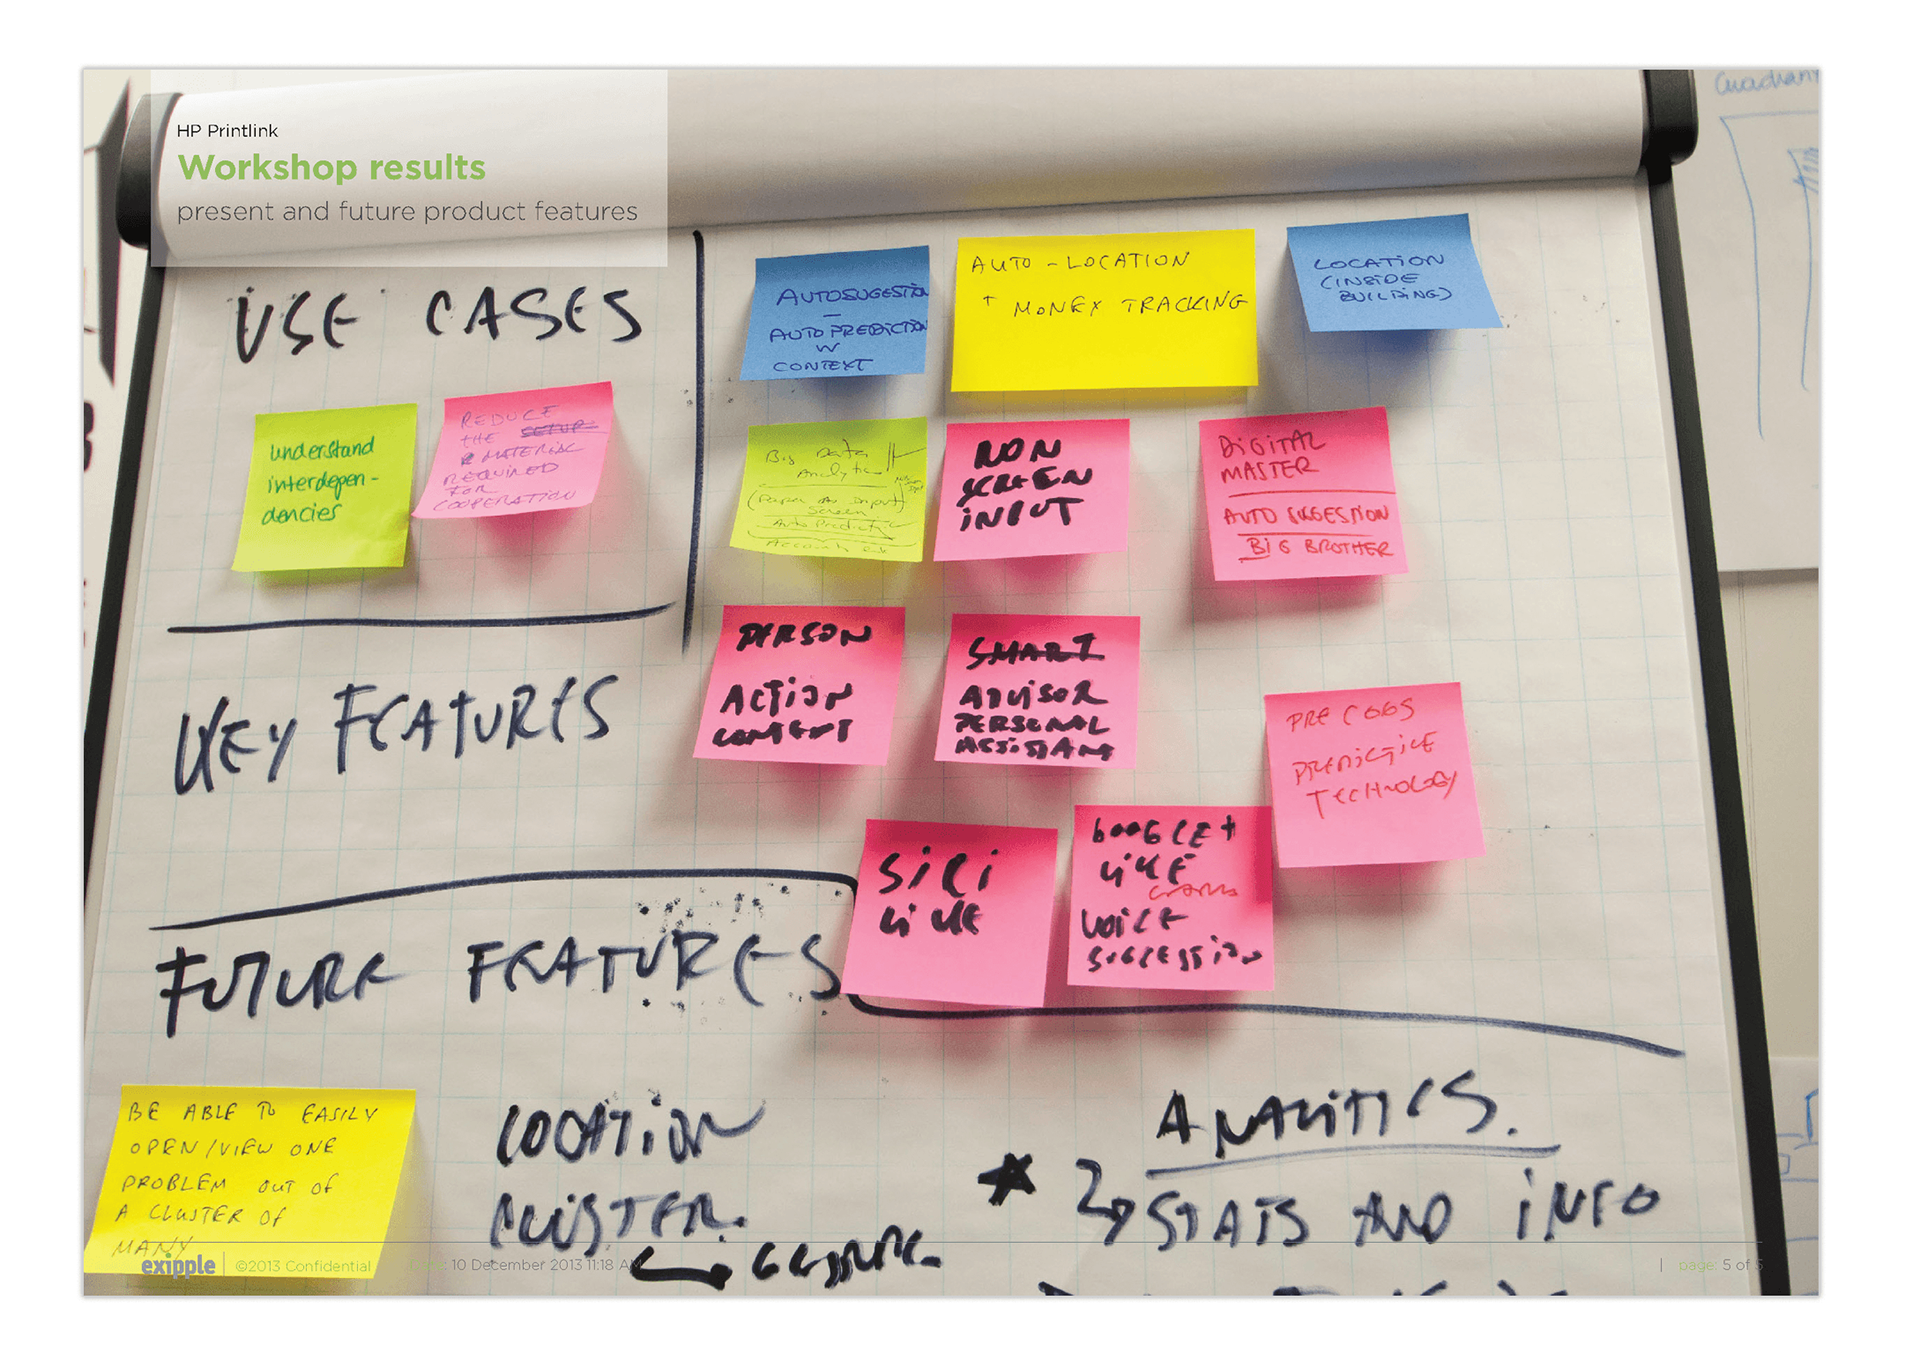
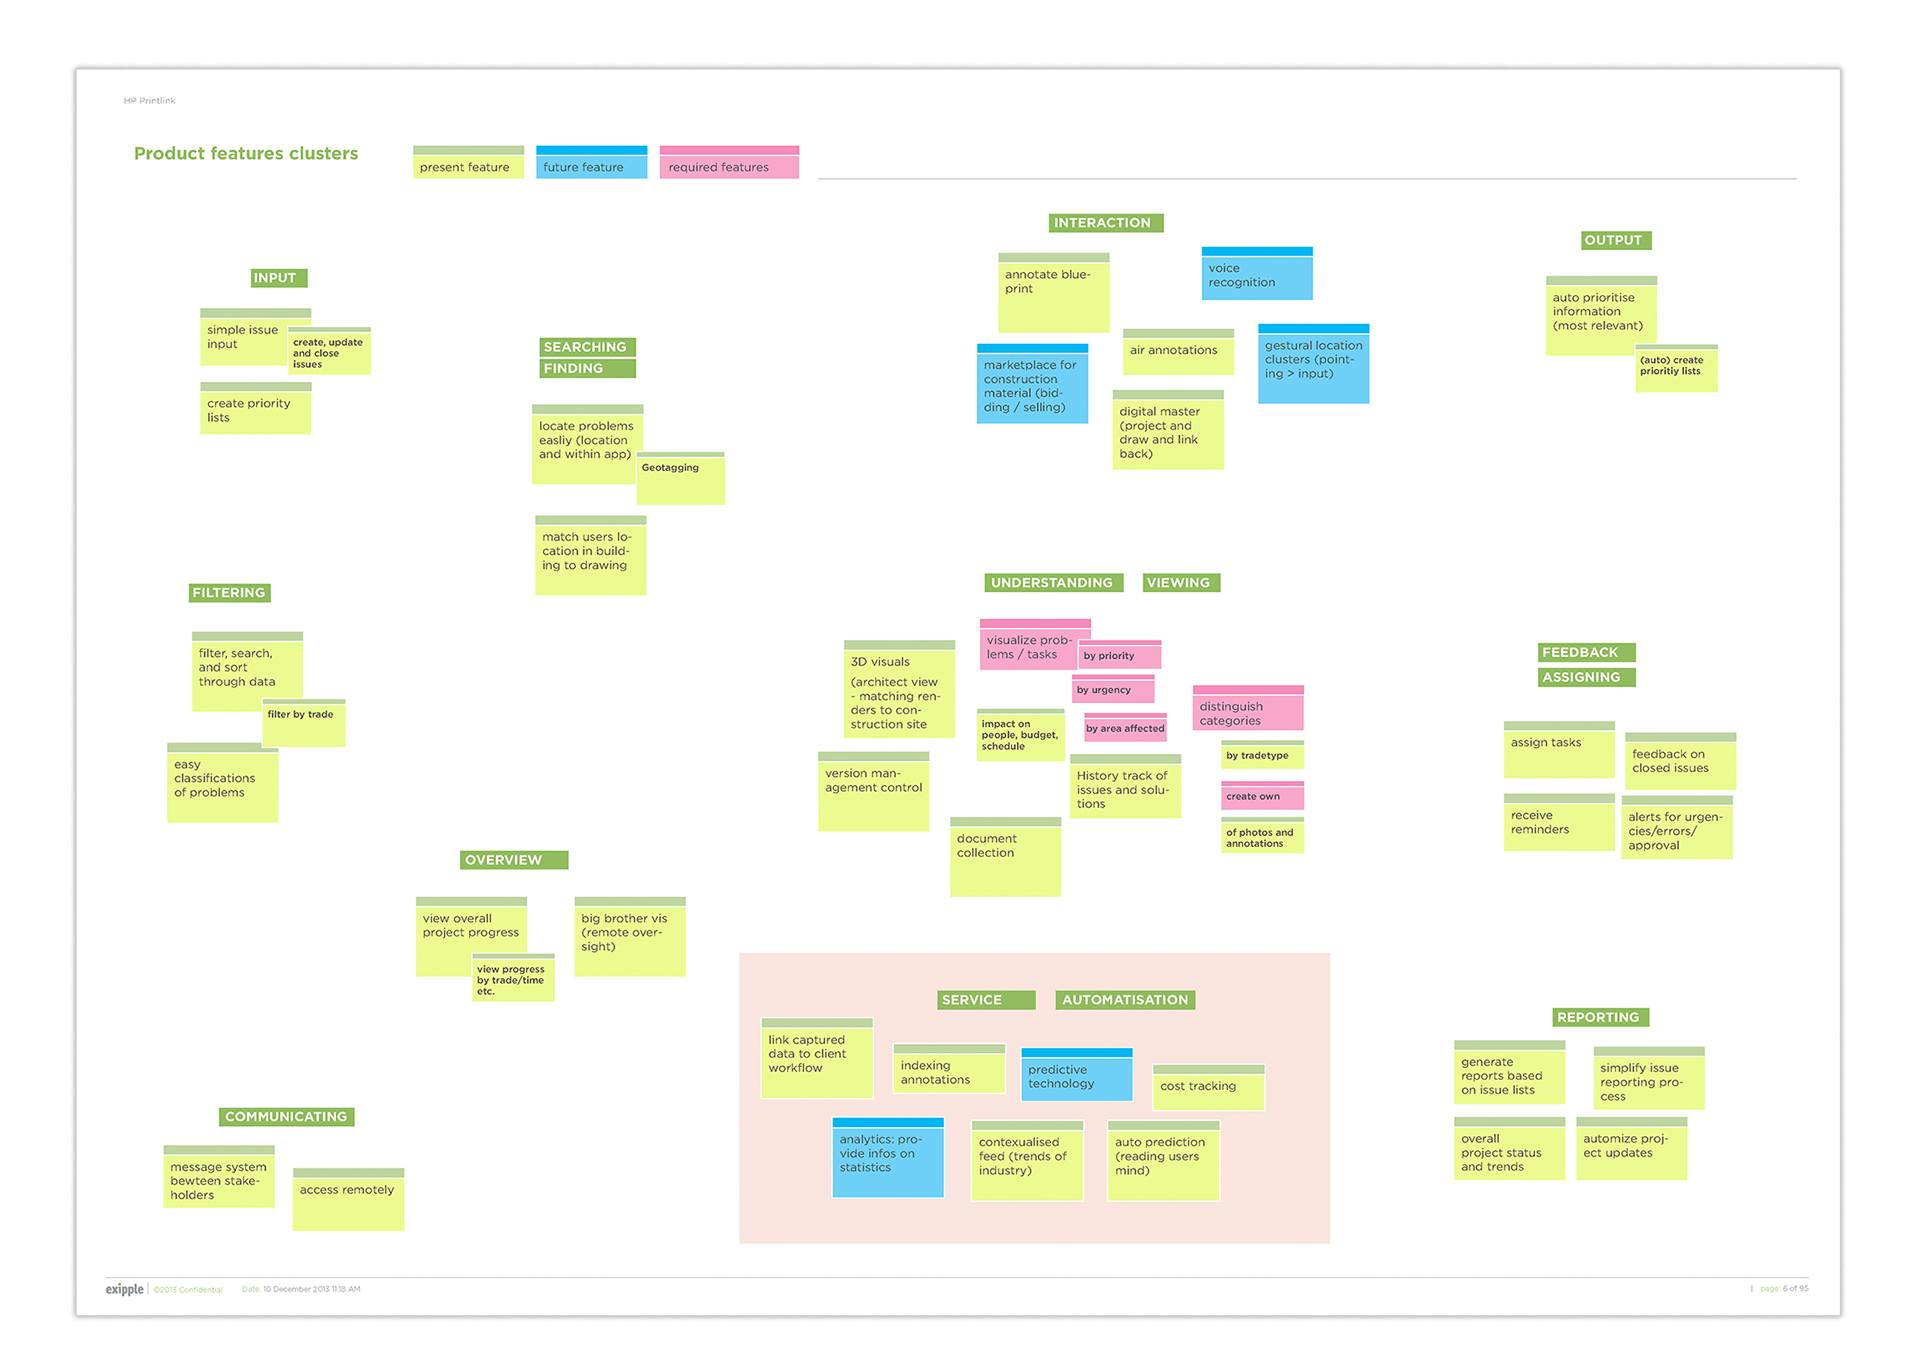
Current, future and required feature gathering
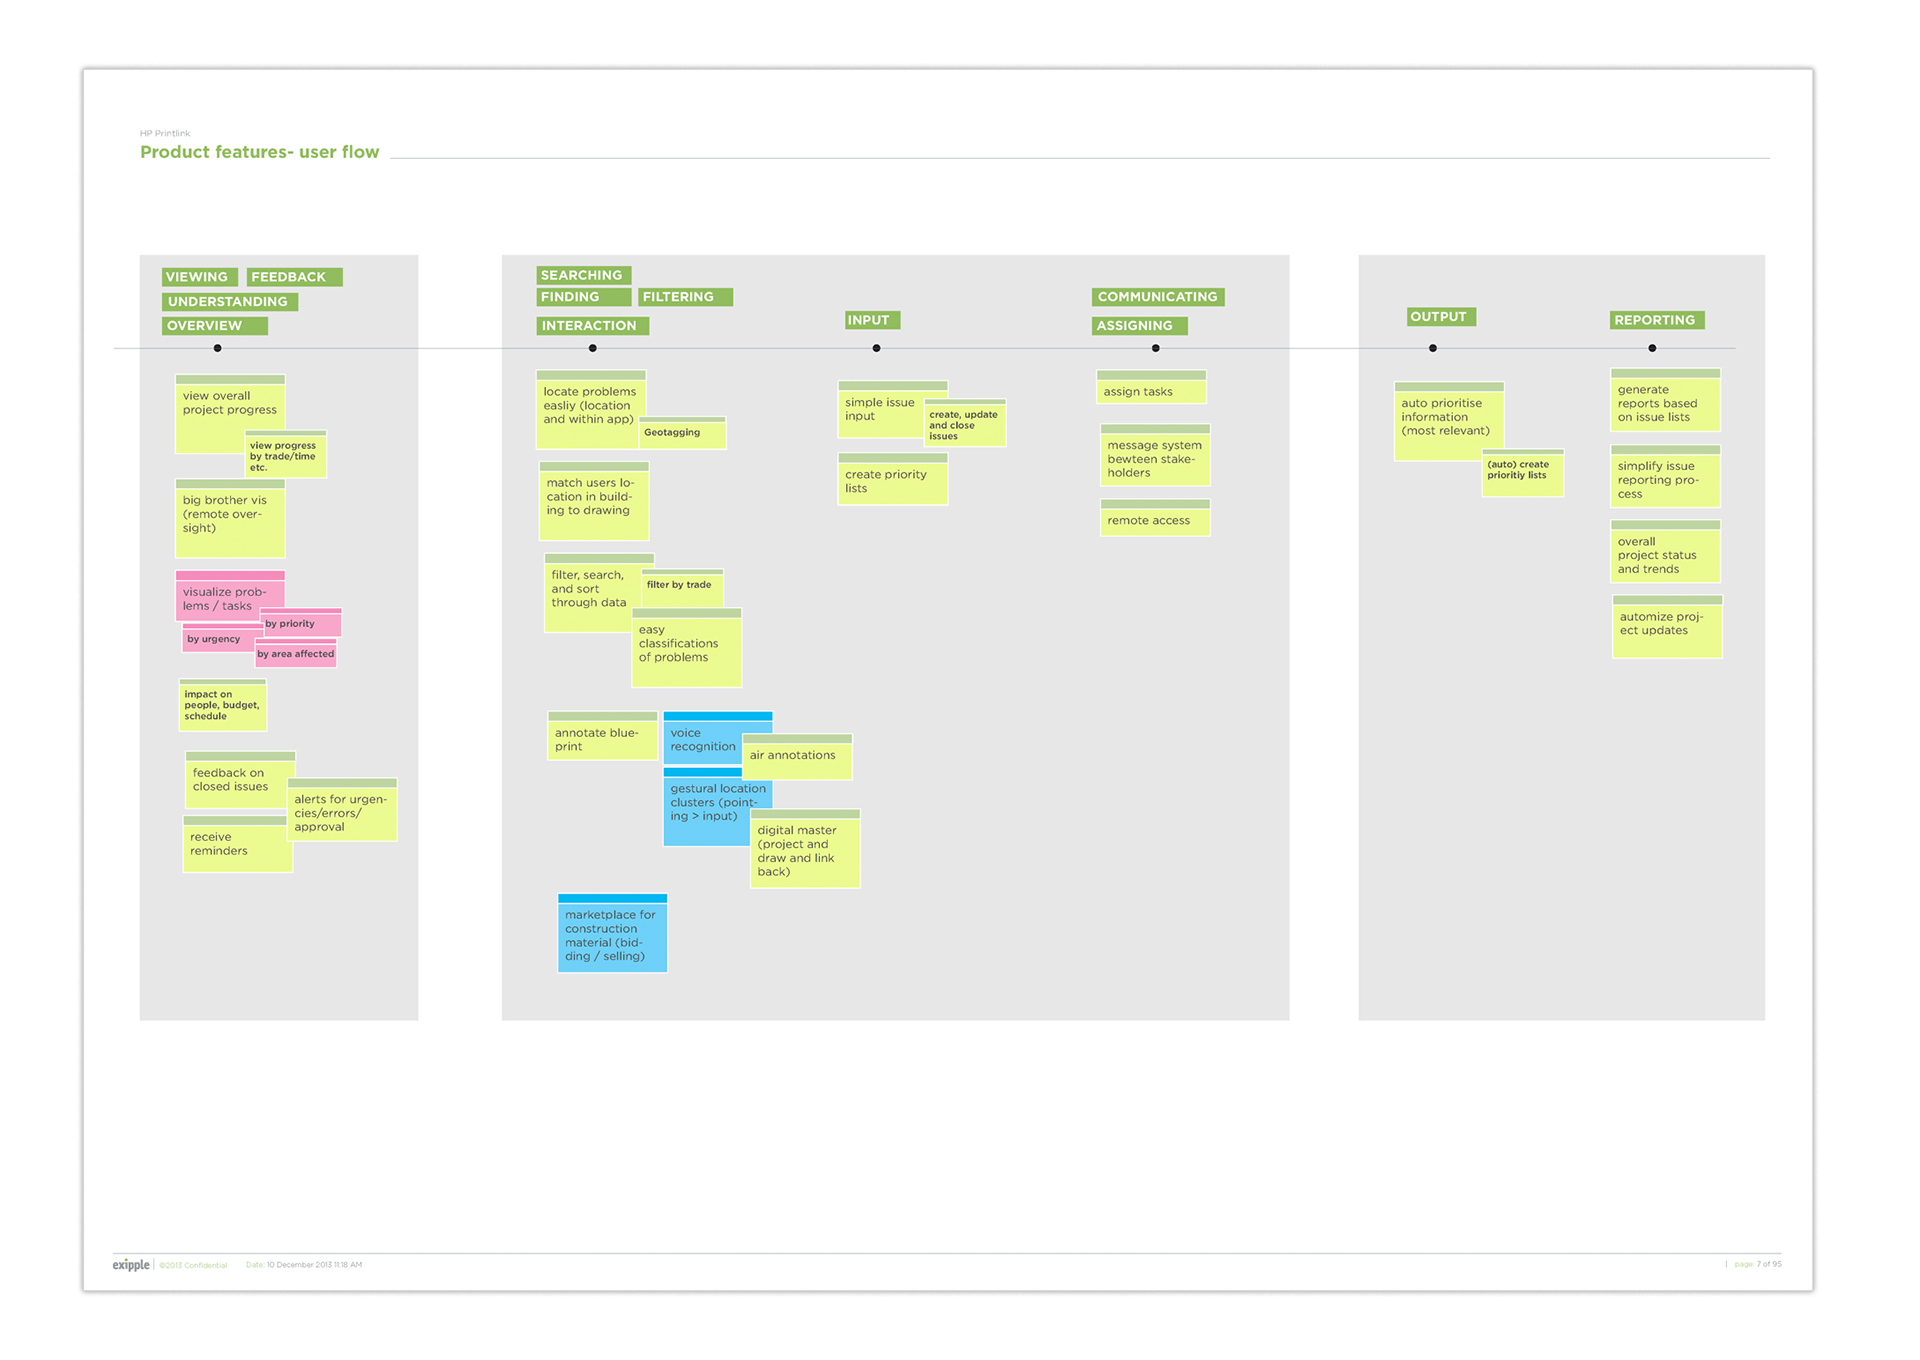
Features clustered into a high level user flow
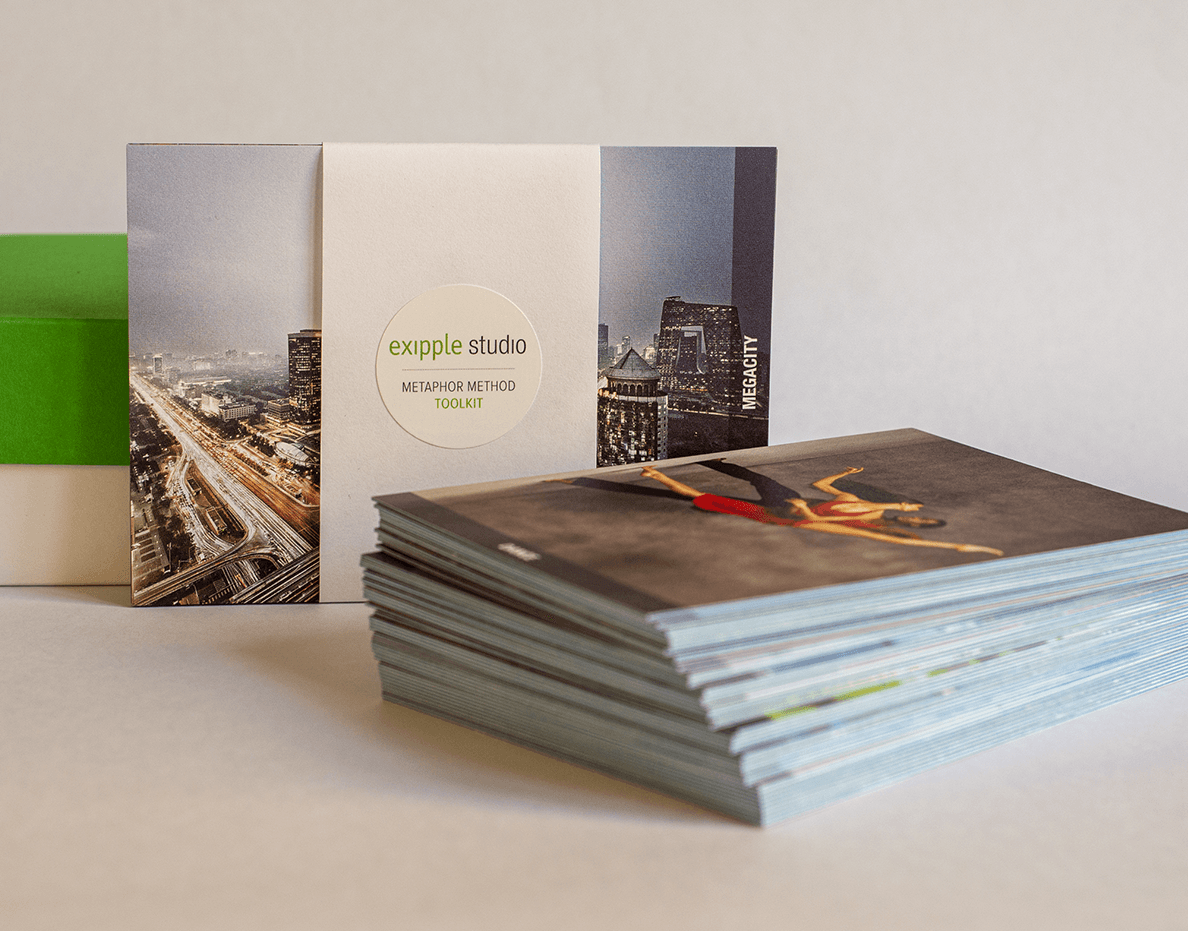
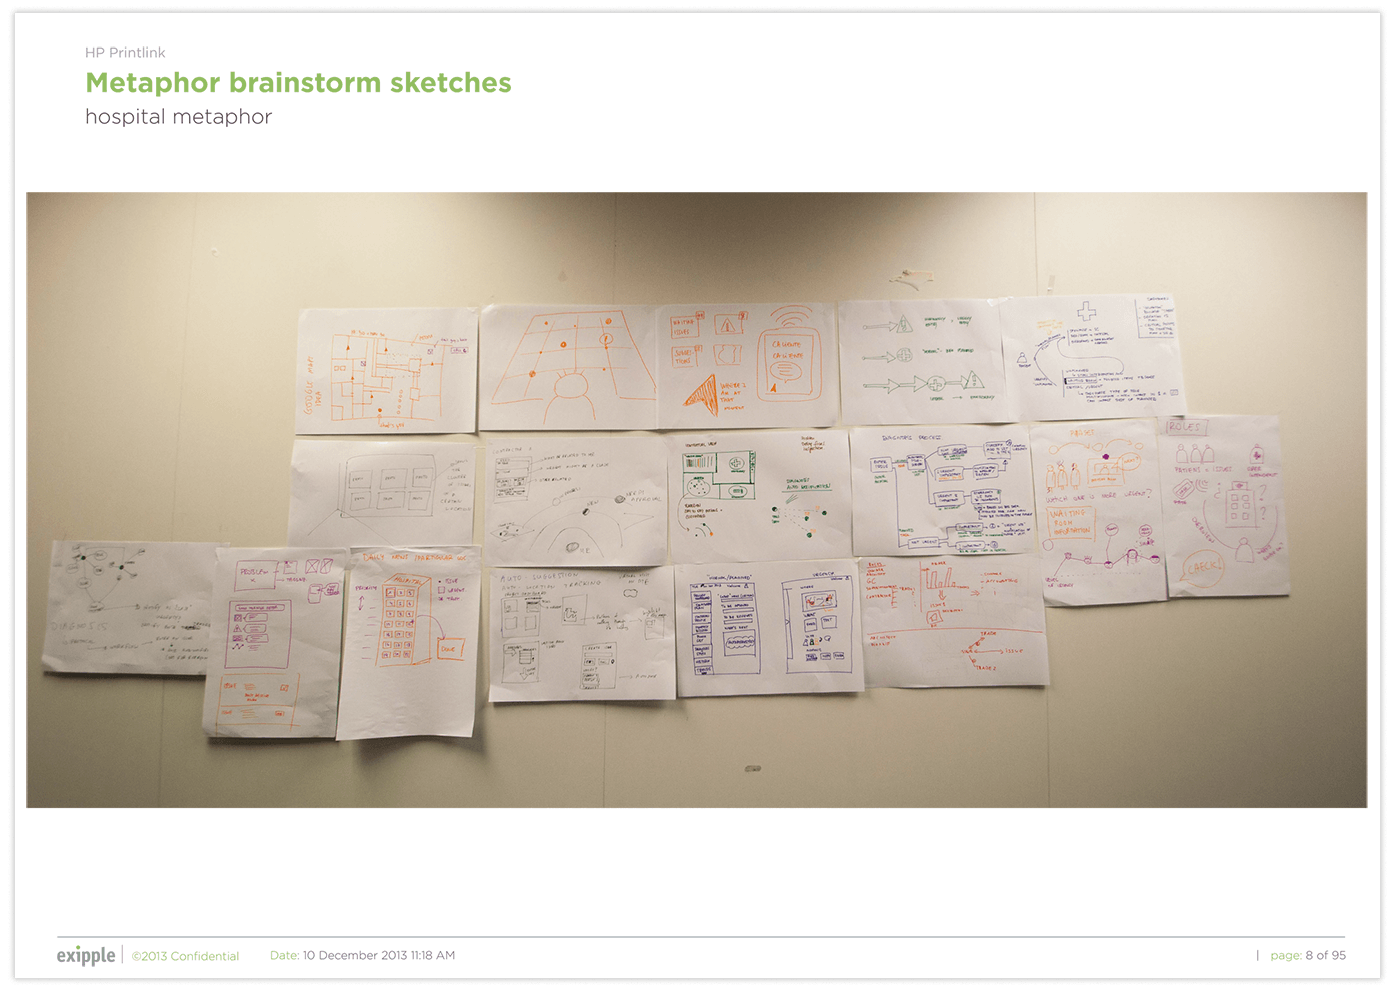
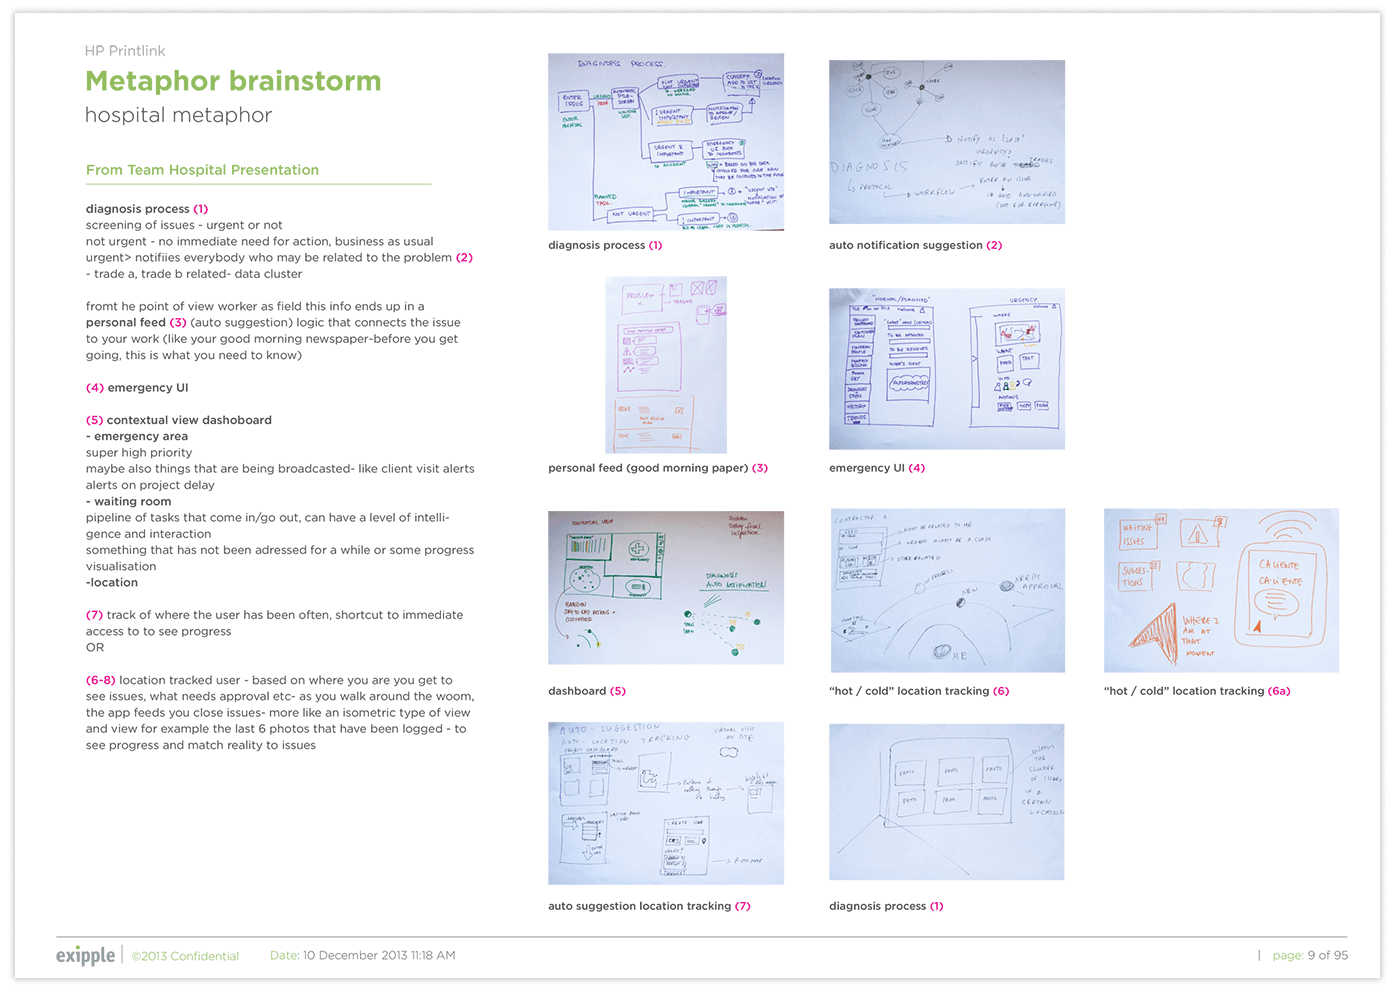
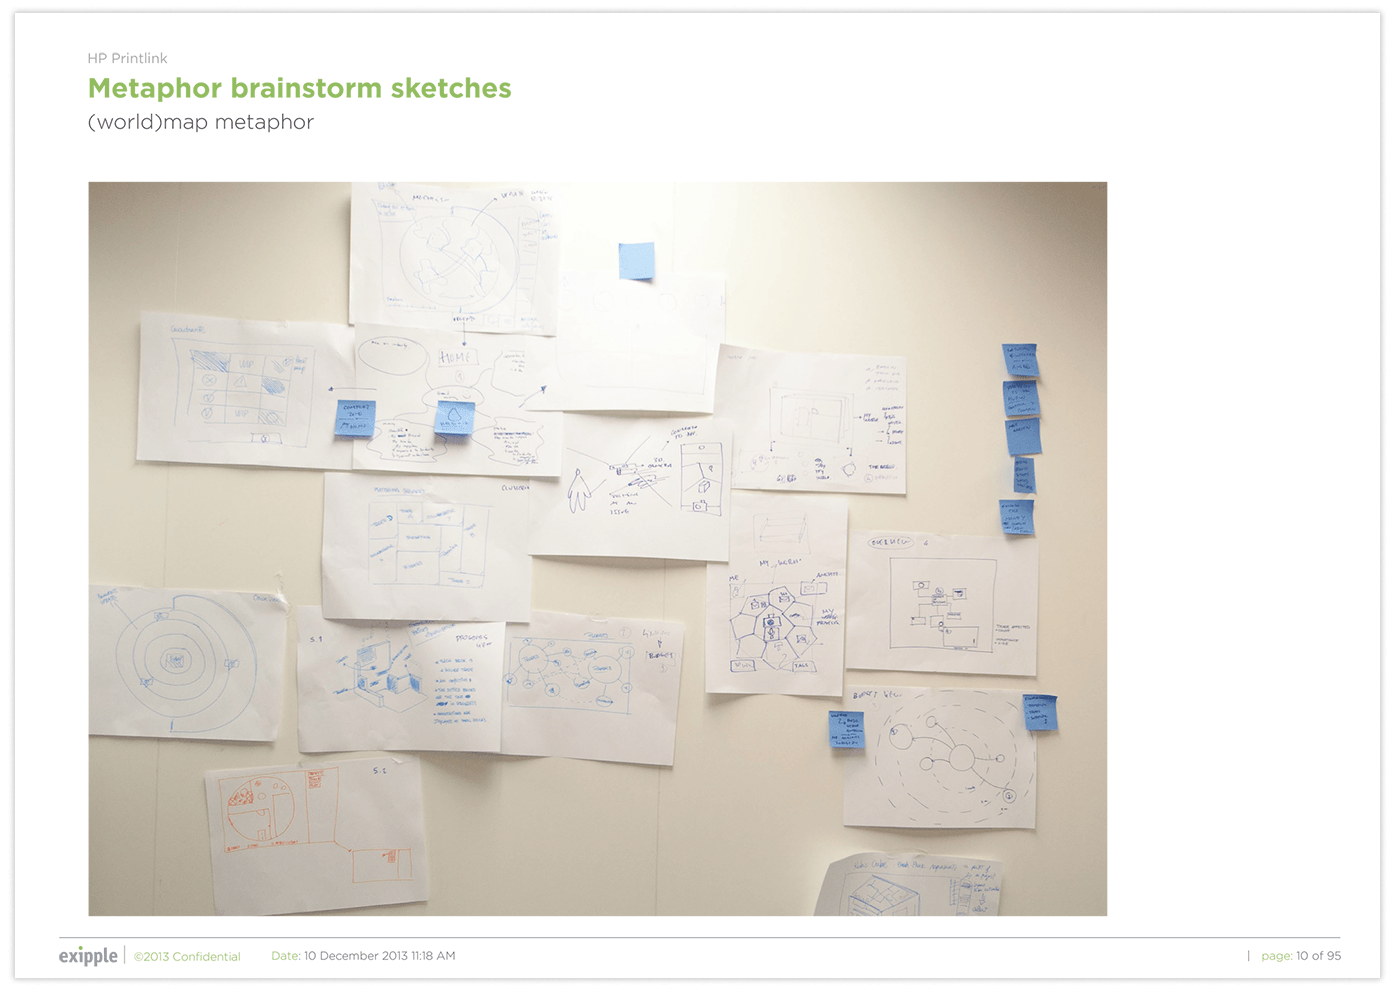
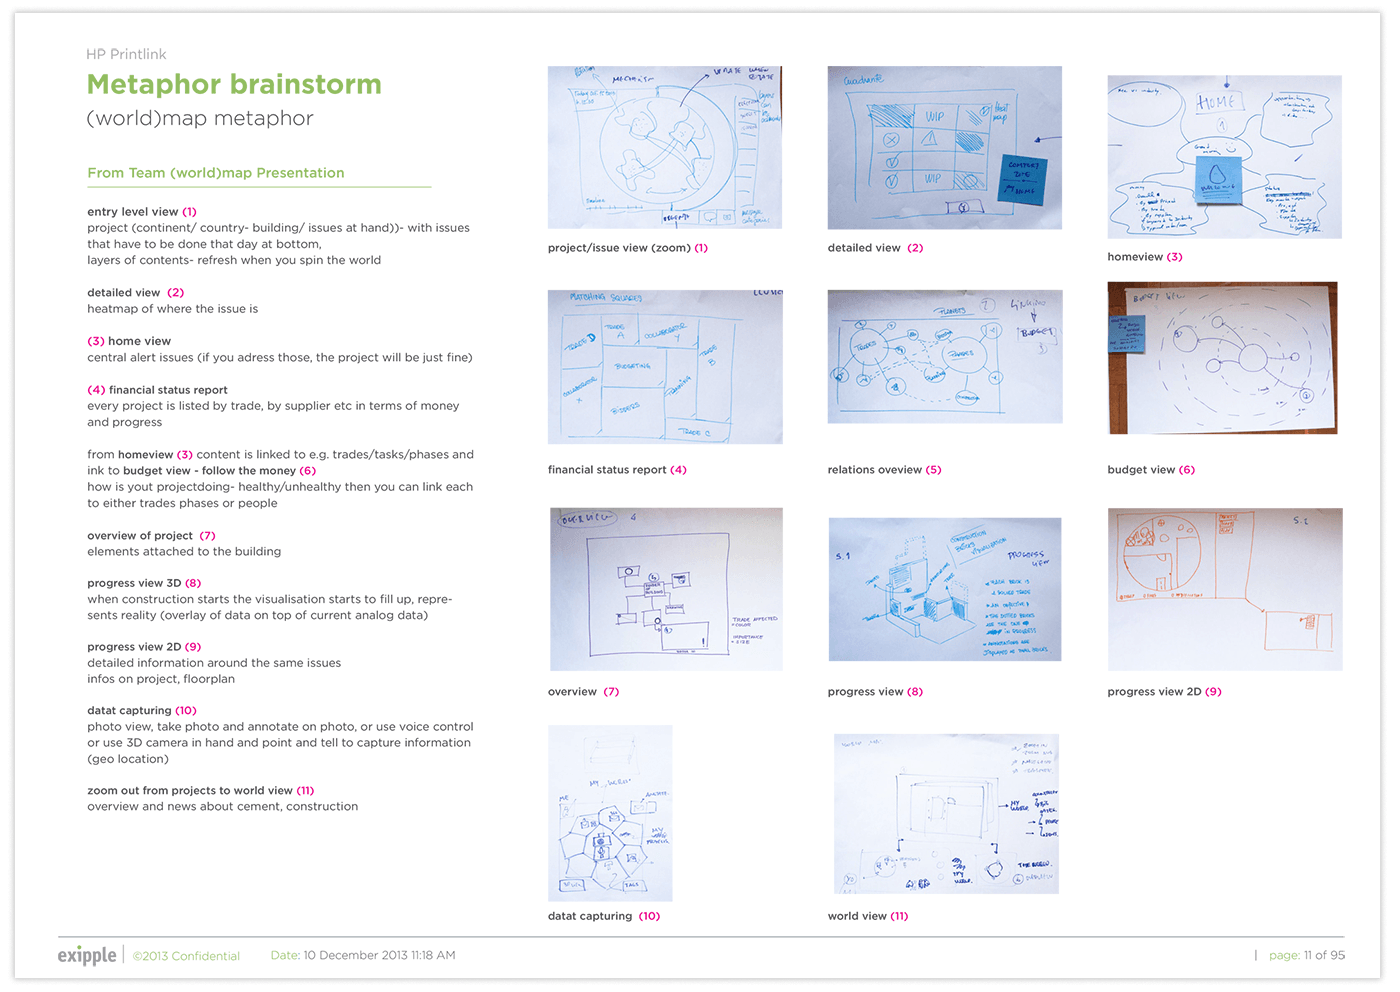
We used the creative "metaphor brainstorm method". I then analysed and described the output to agree on a selection of ideas and to start the wireframe process.
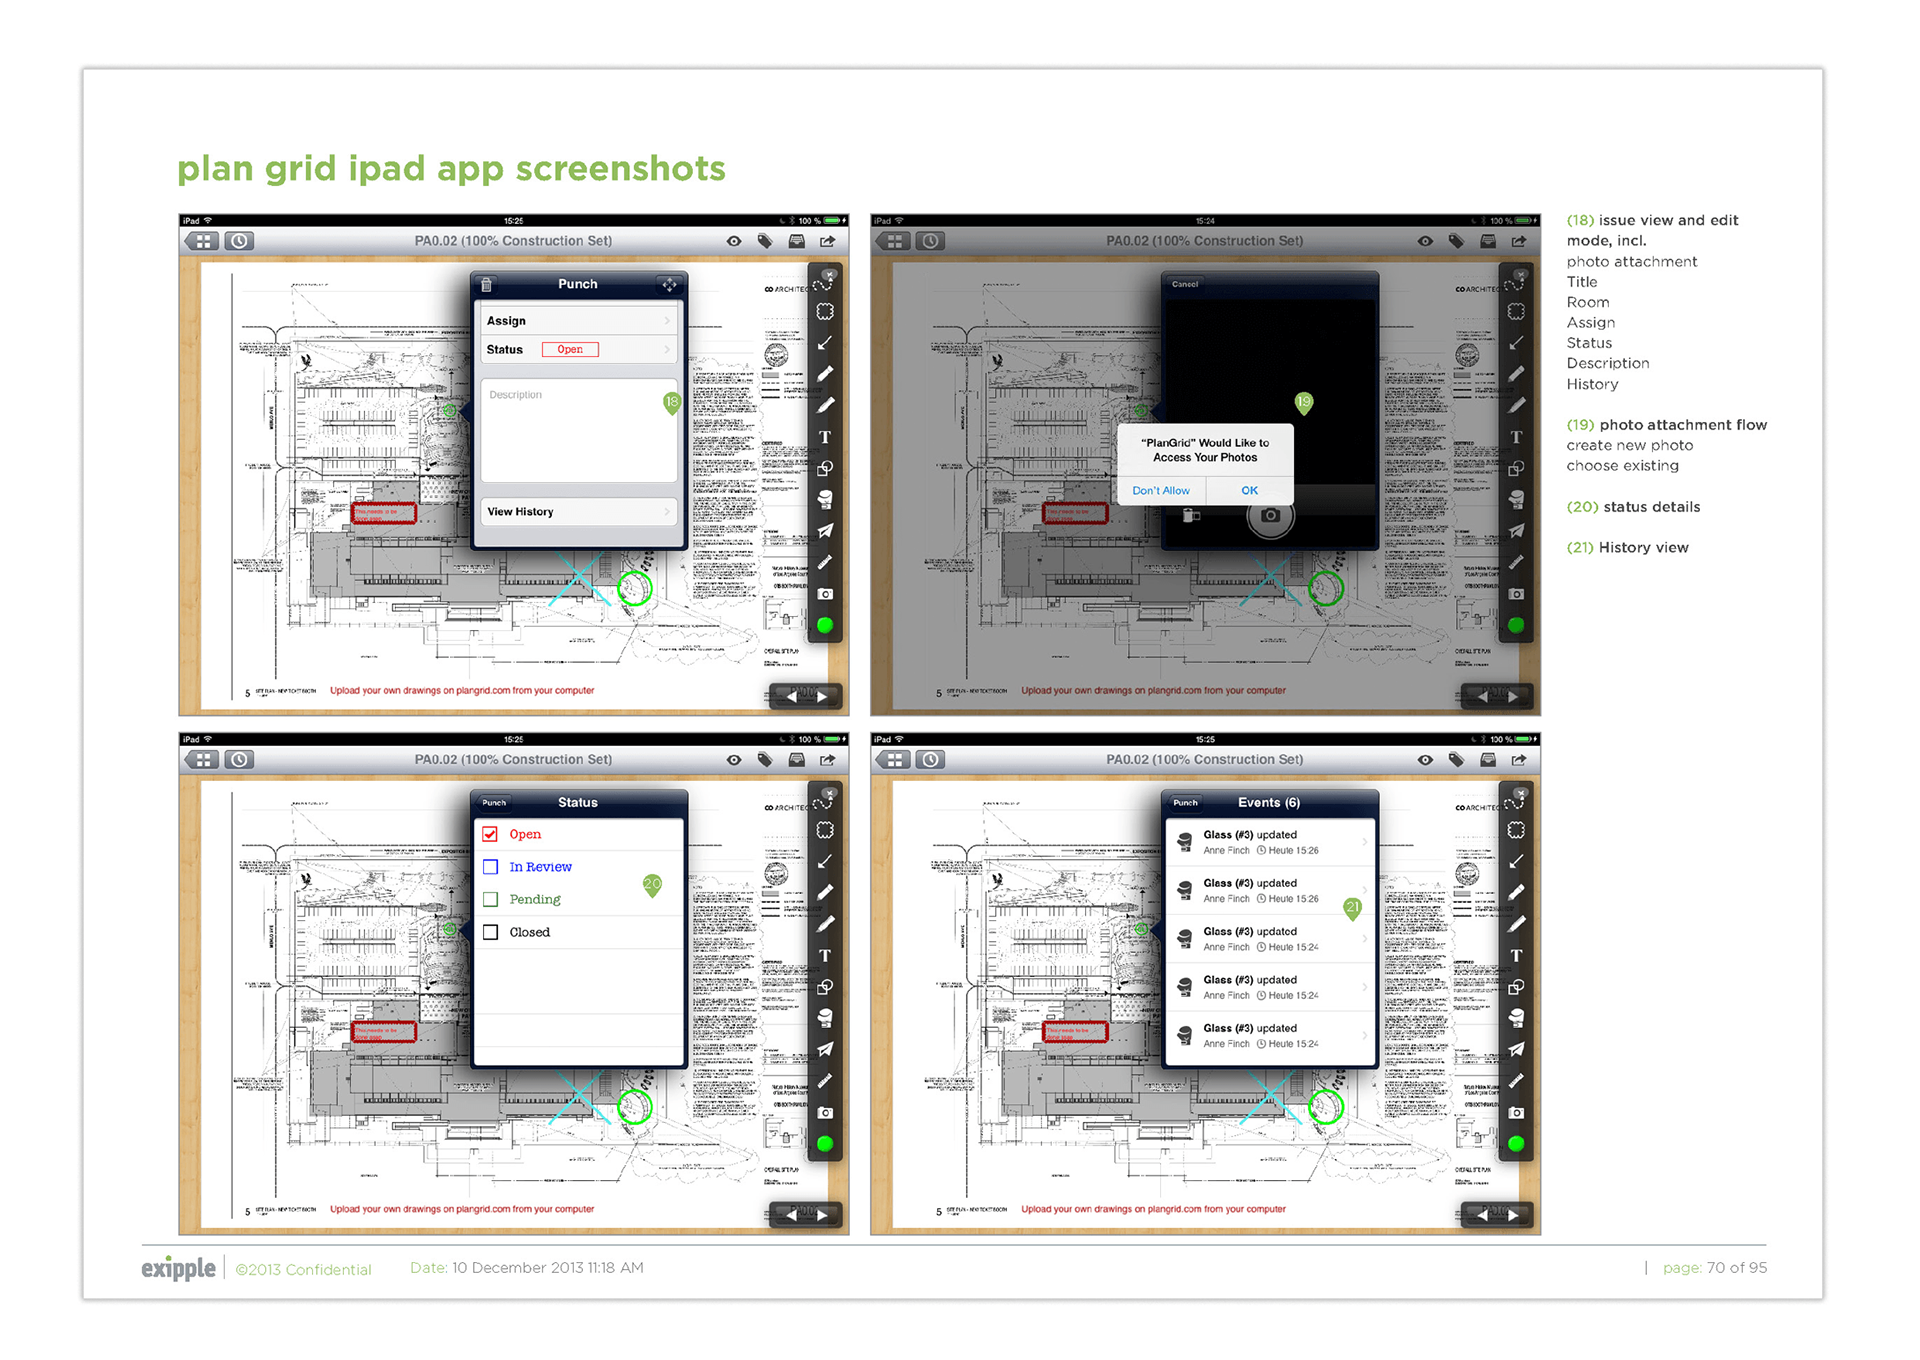
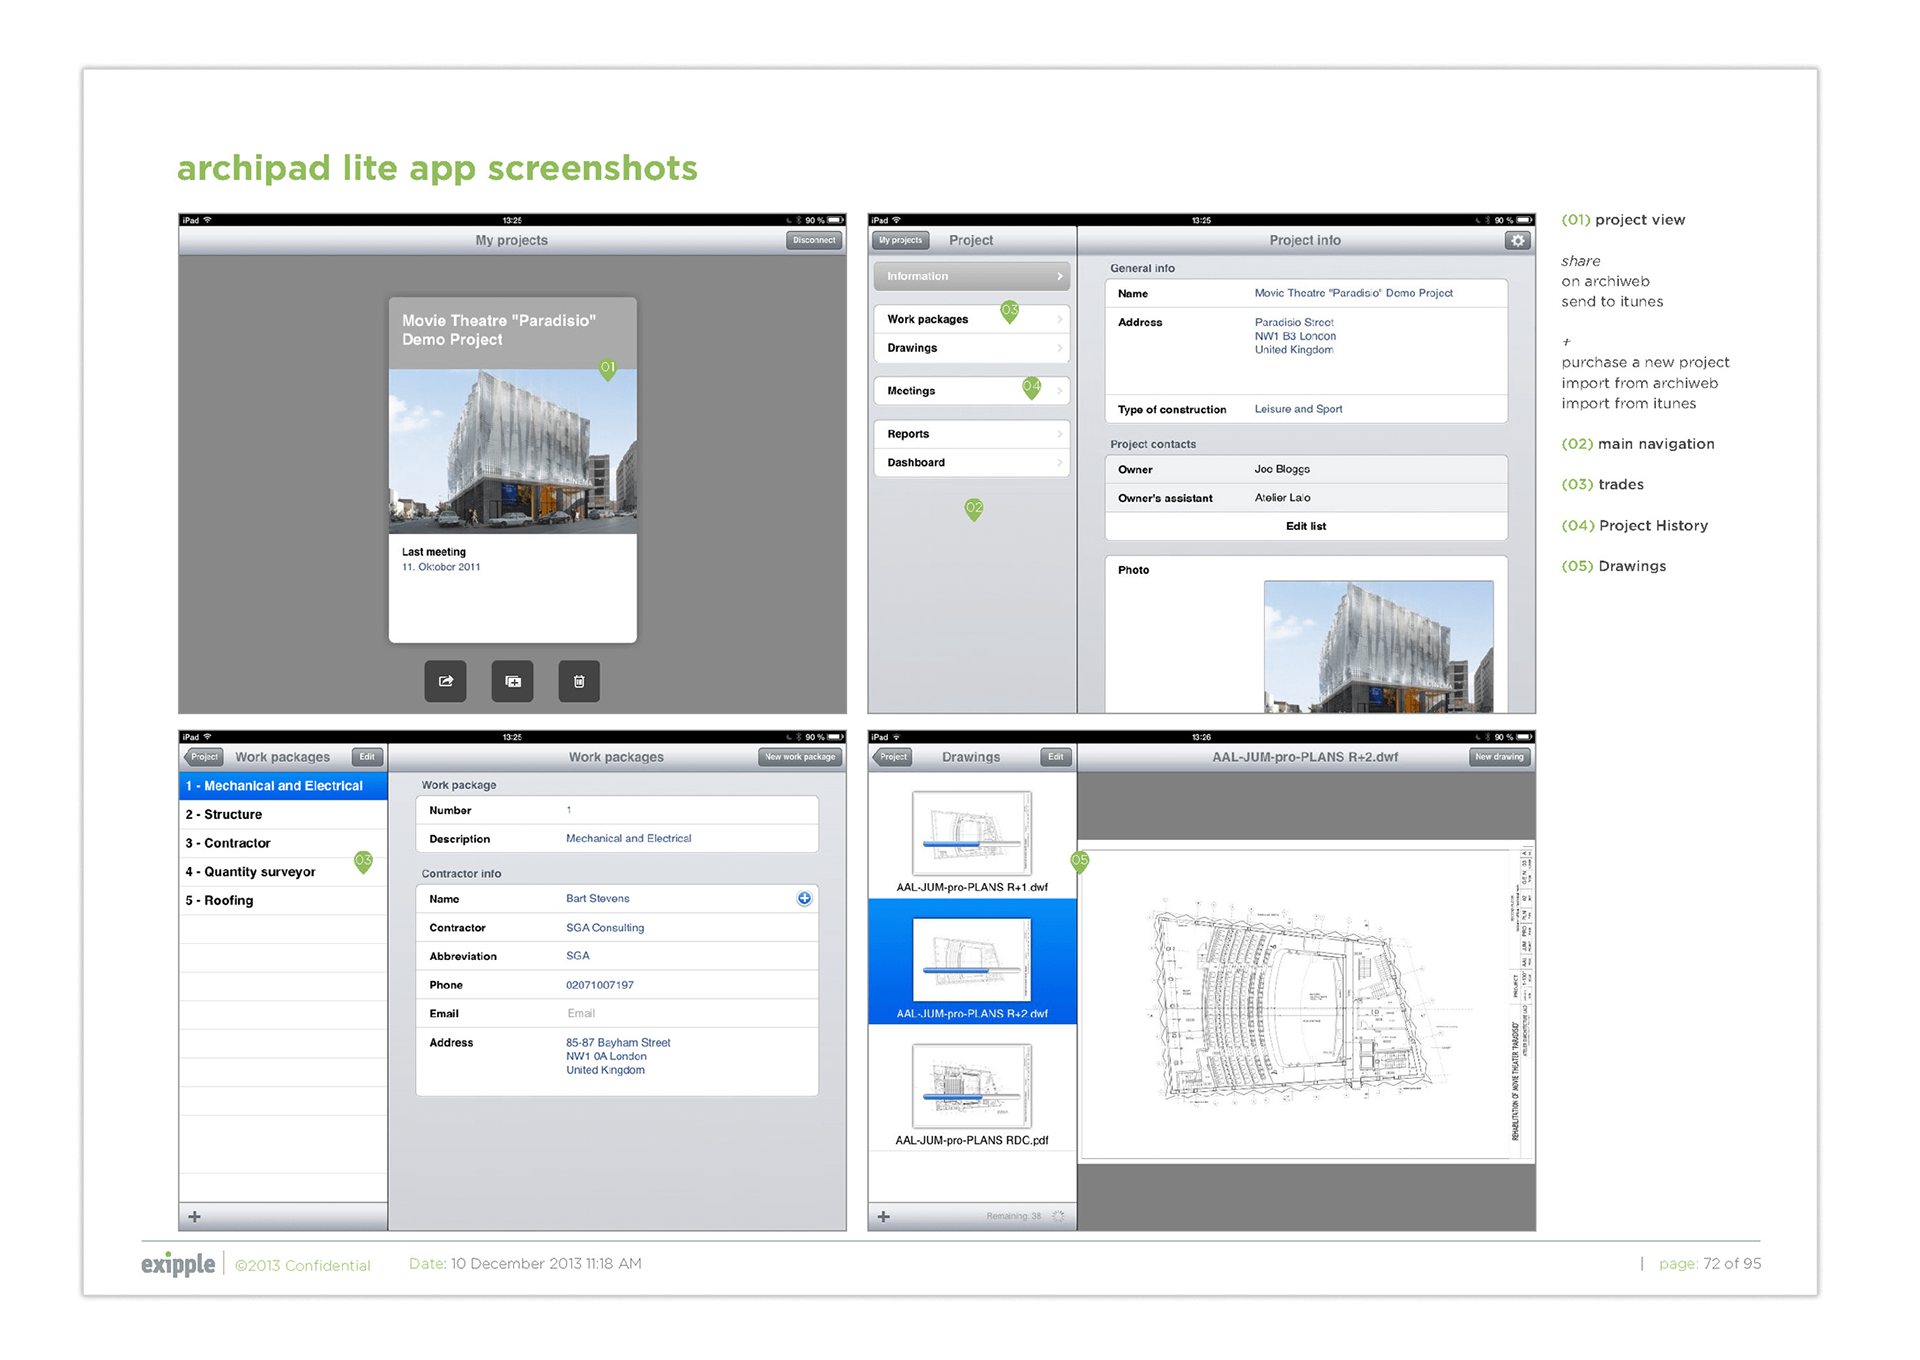
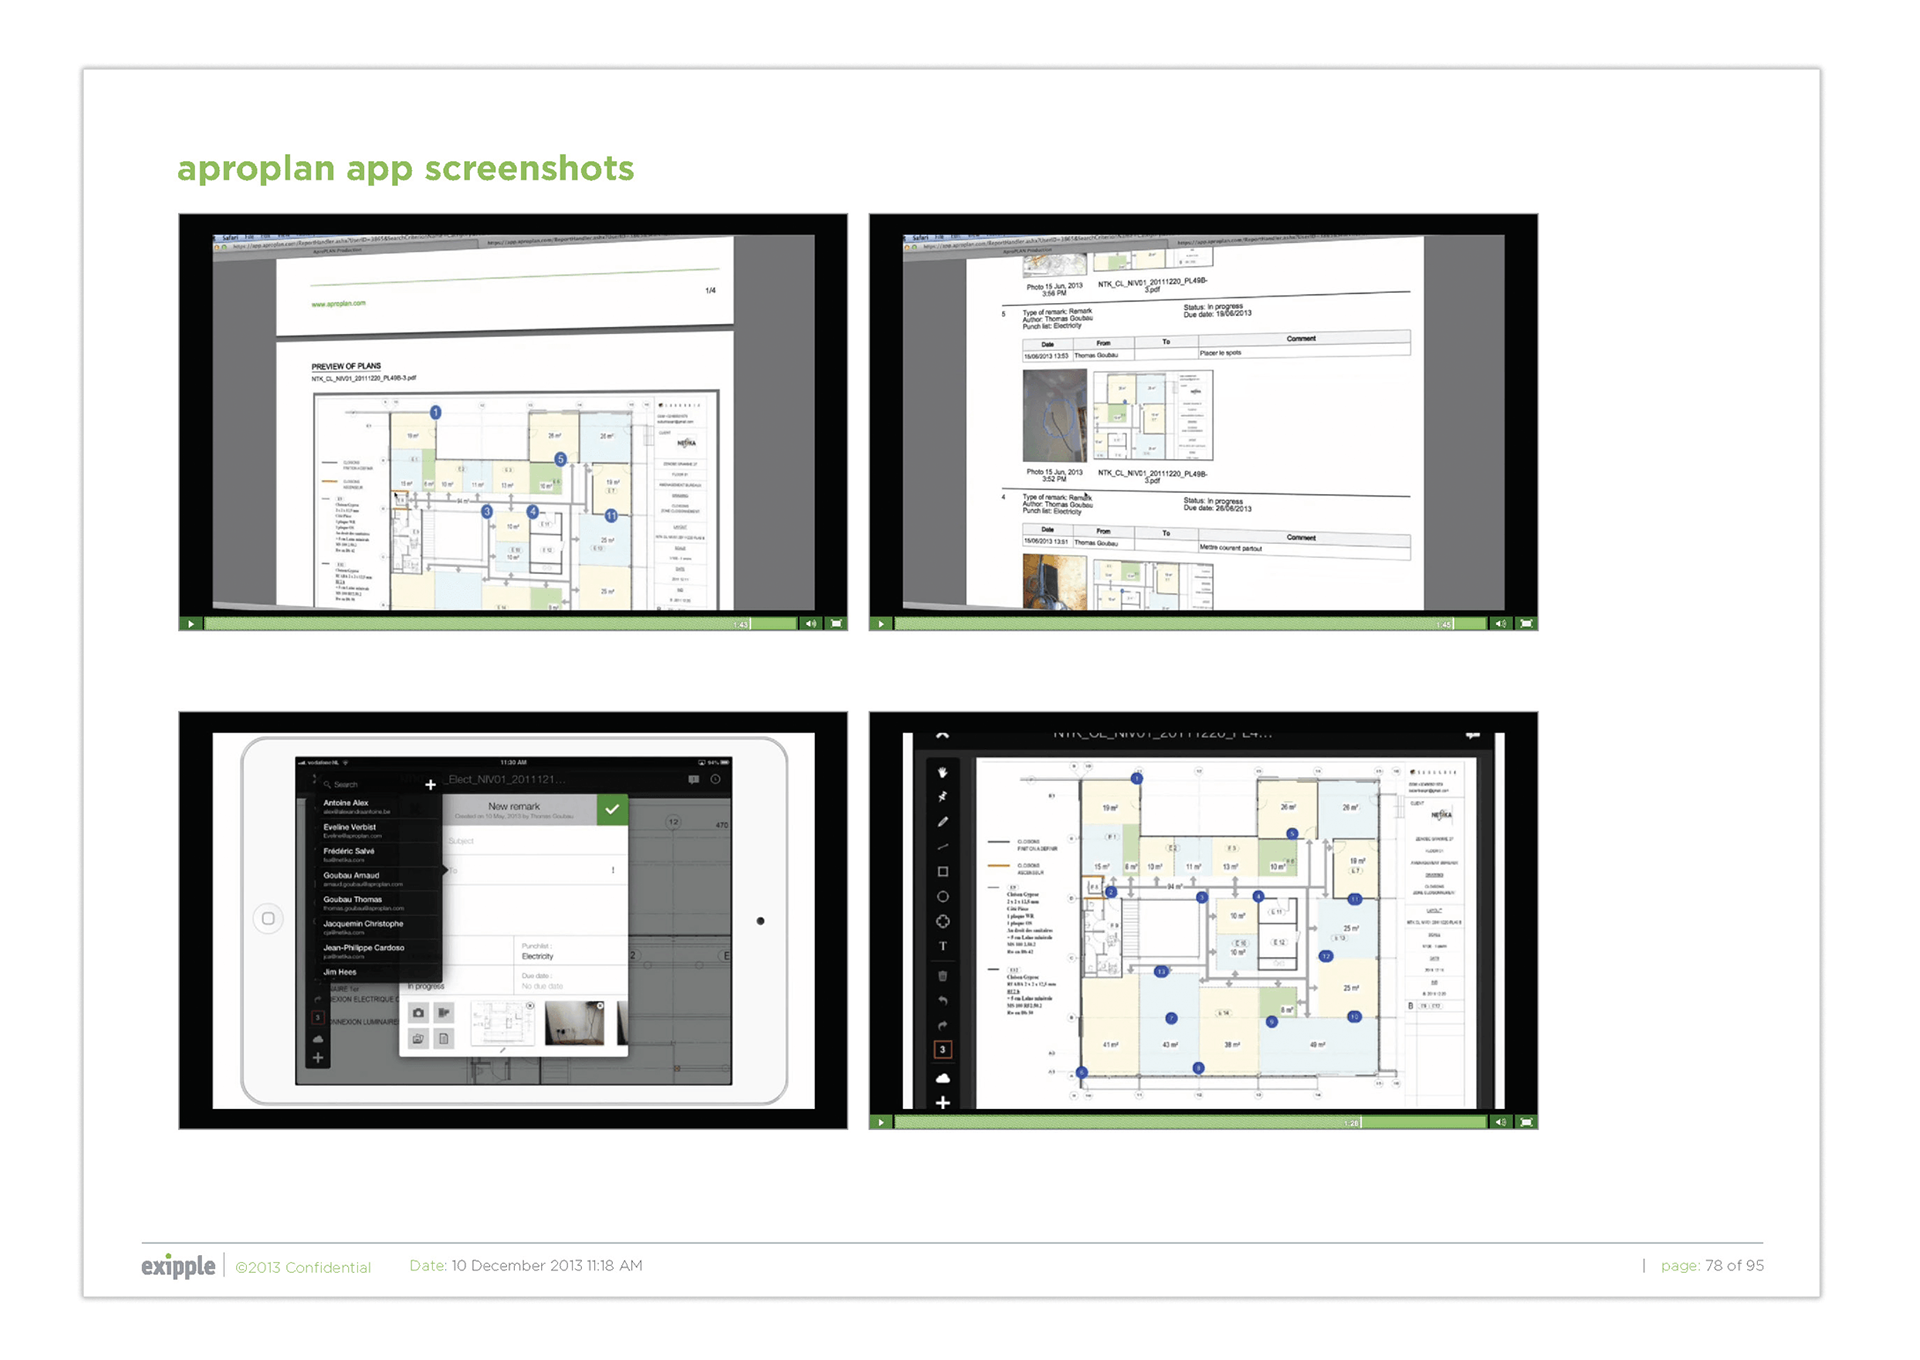
Step 2: Competitive analysis review
Test and analyse similar apps in regards to their strengths and weaknesses and features.
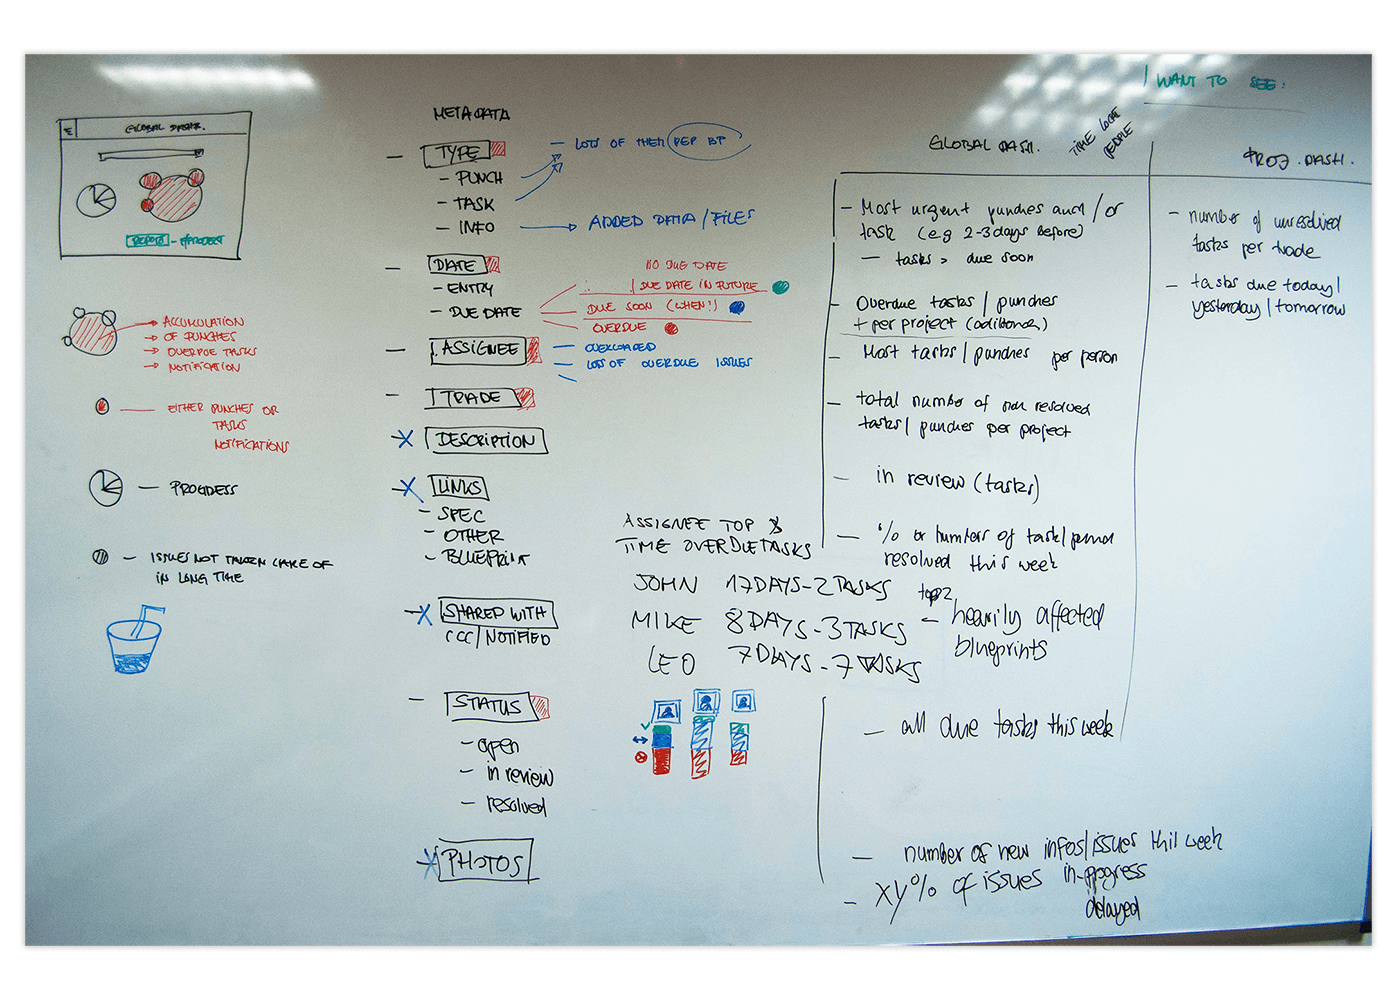
Step 3: Thinking, sketching, rethinking
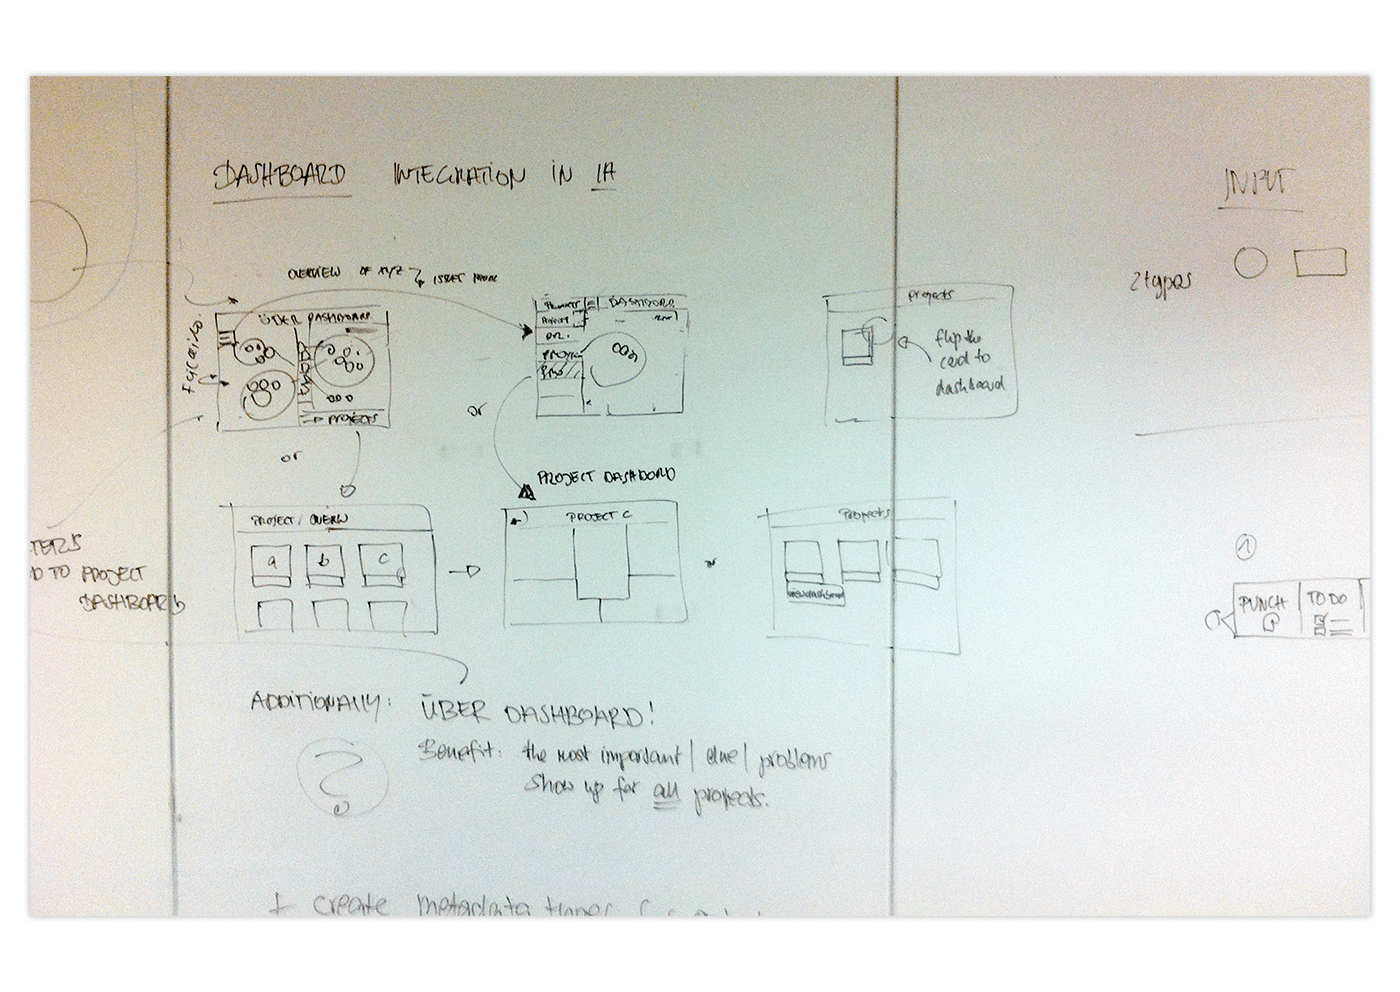
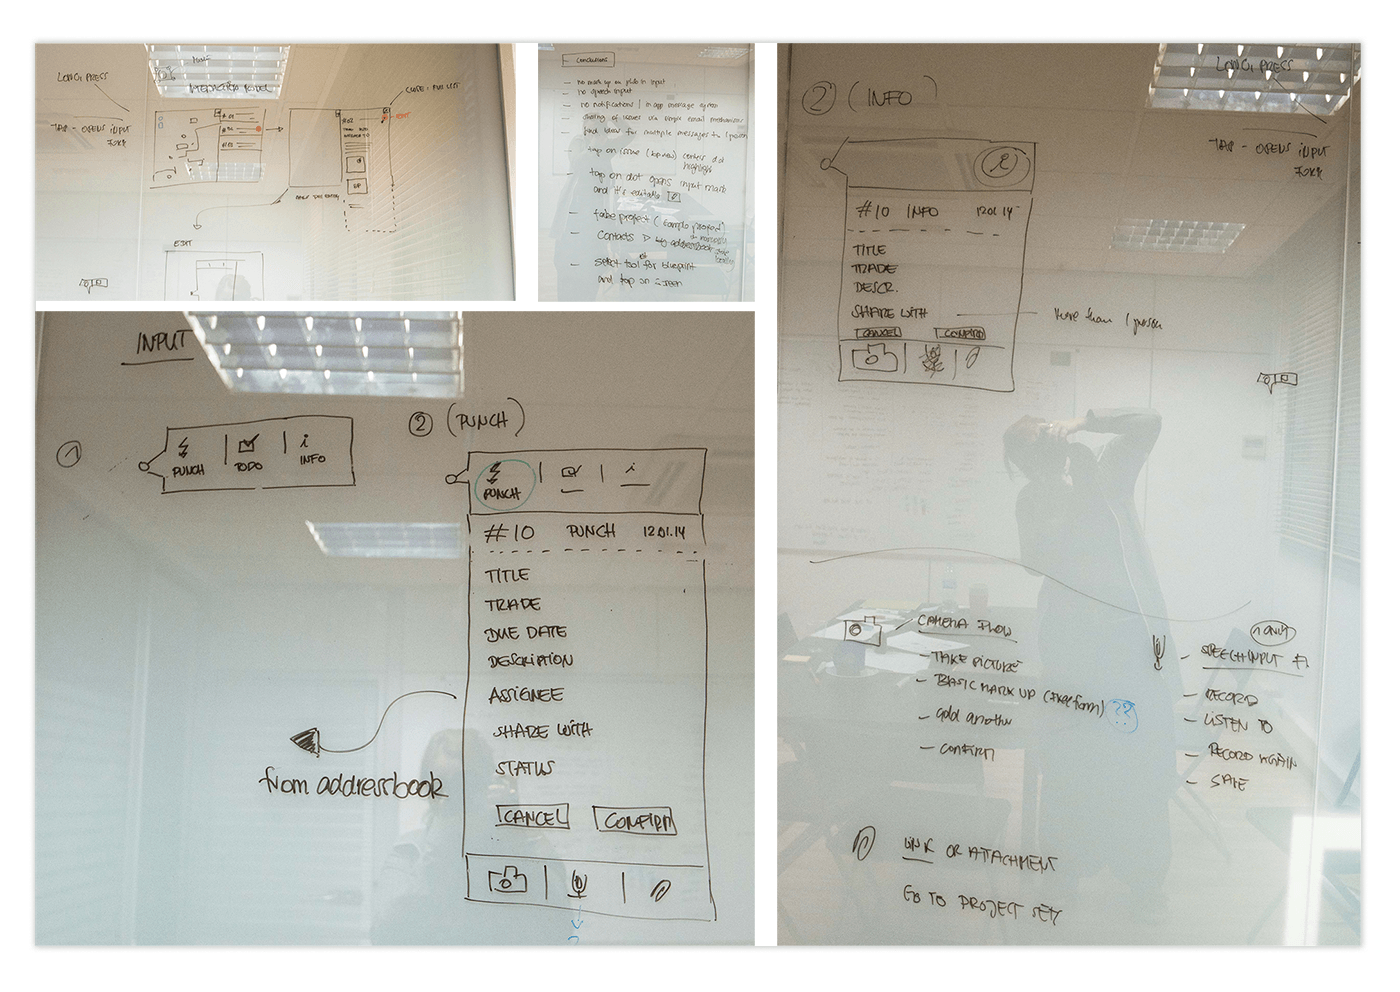
Together with the client I went to the whiteboard a lot and we sketched out many possible solutions for some interactions before I started to wireframe.
Step 4: Wireframes
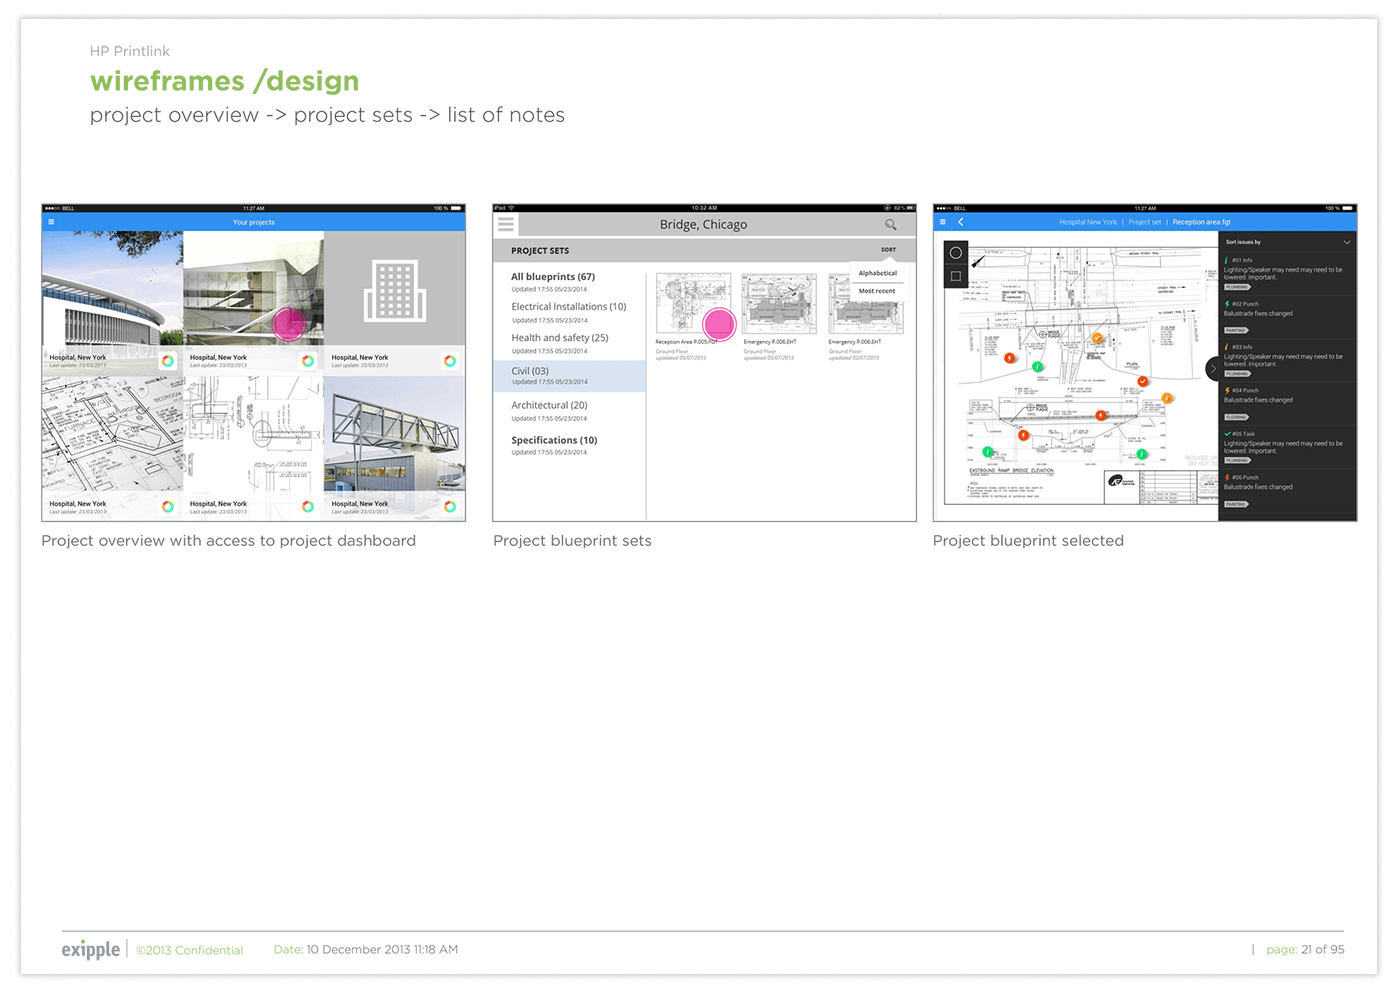
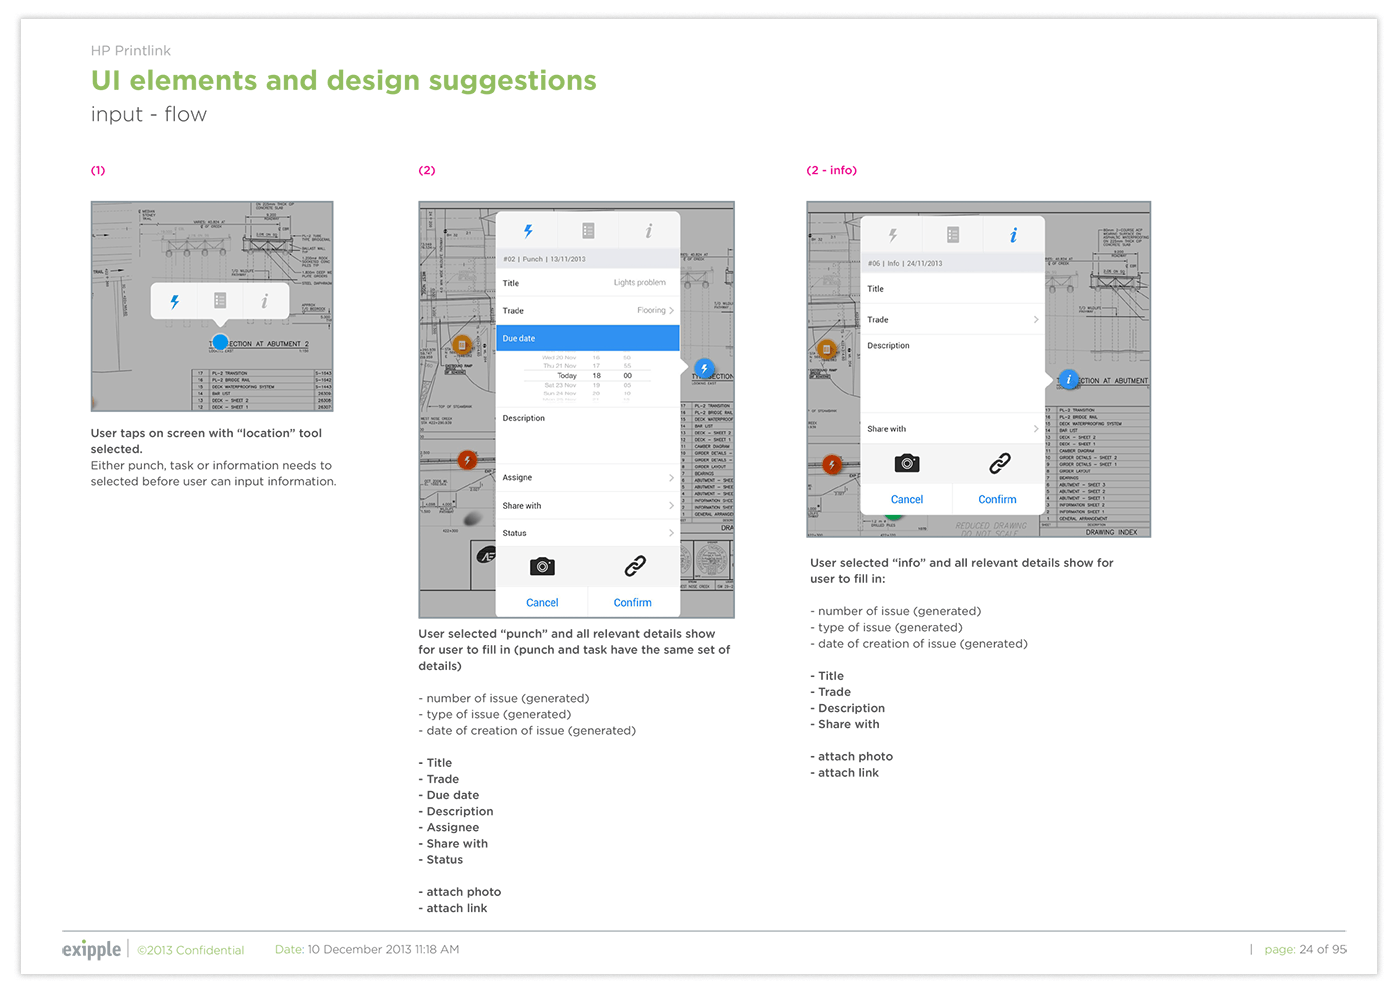
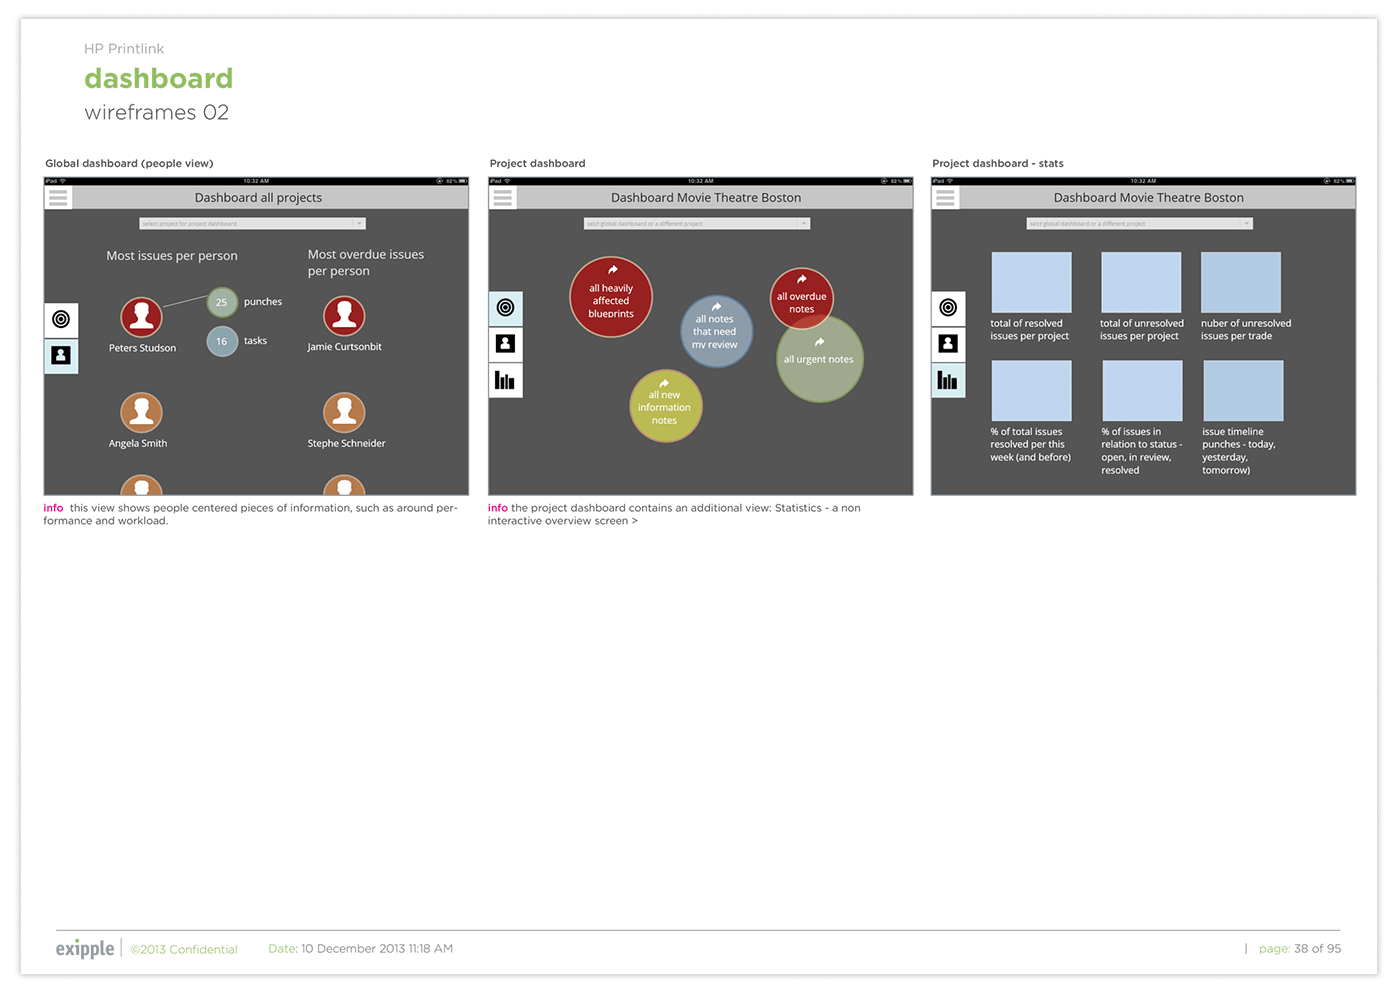
Below are a few examples of early high level wireframes of various views of the application.
Step 5: Visual Design (supervision)
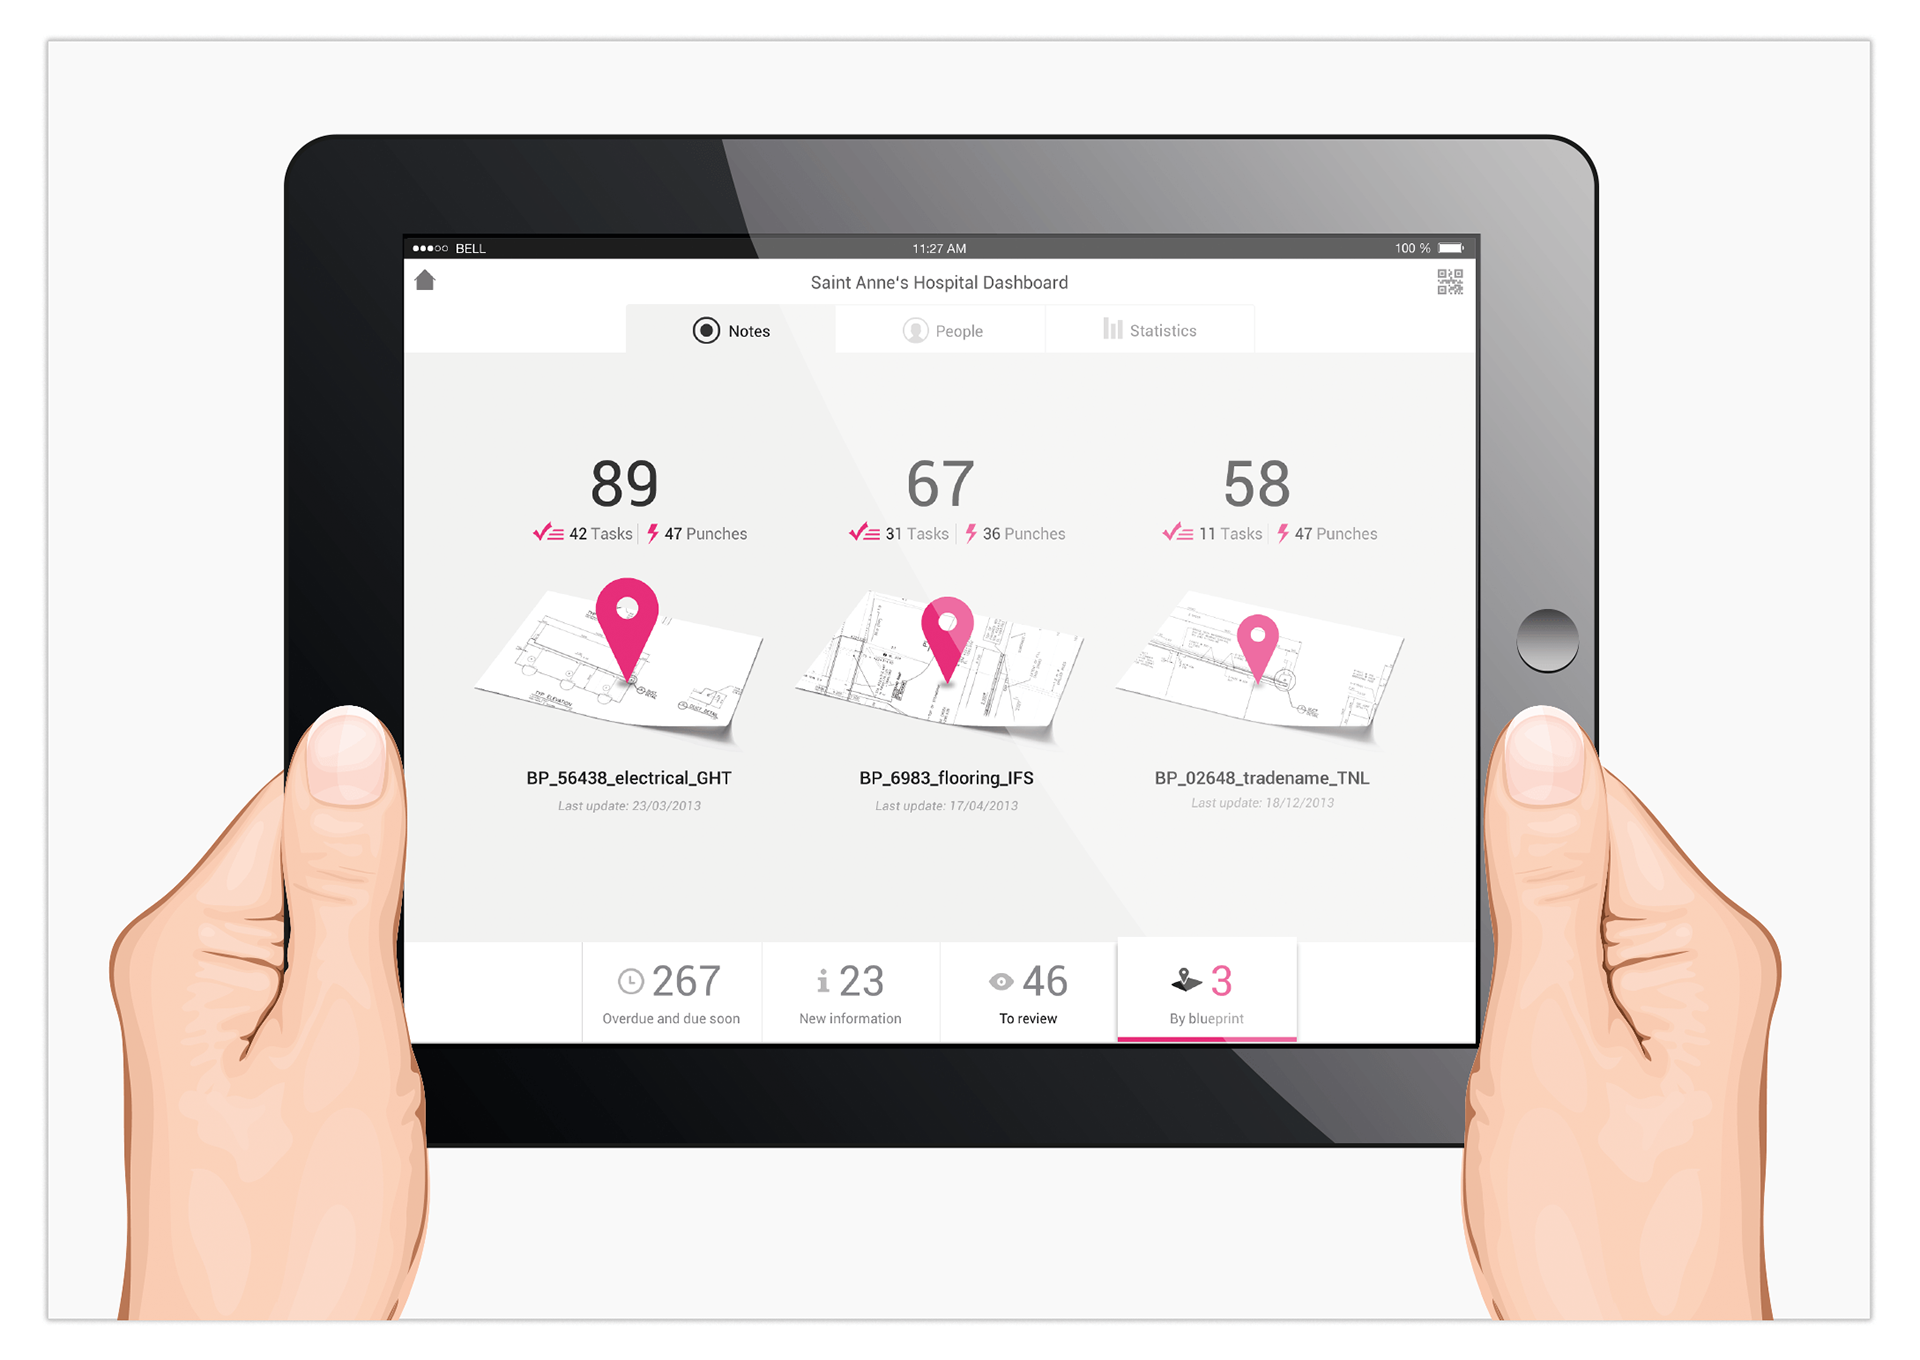
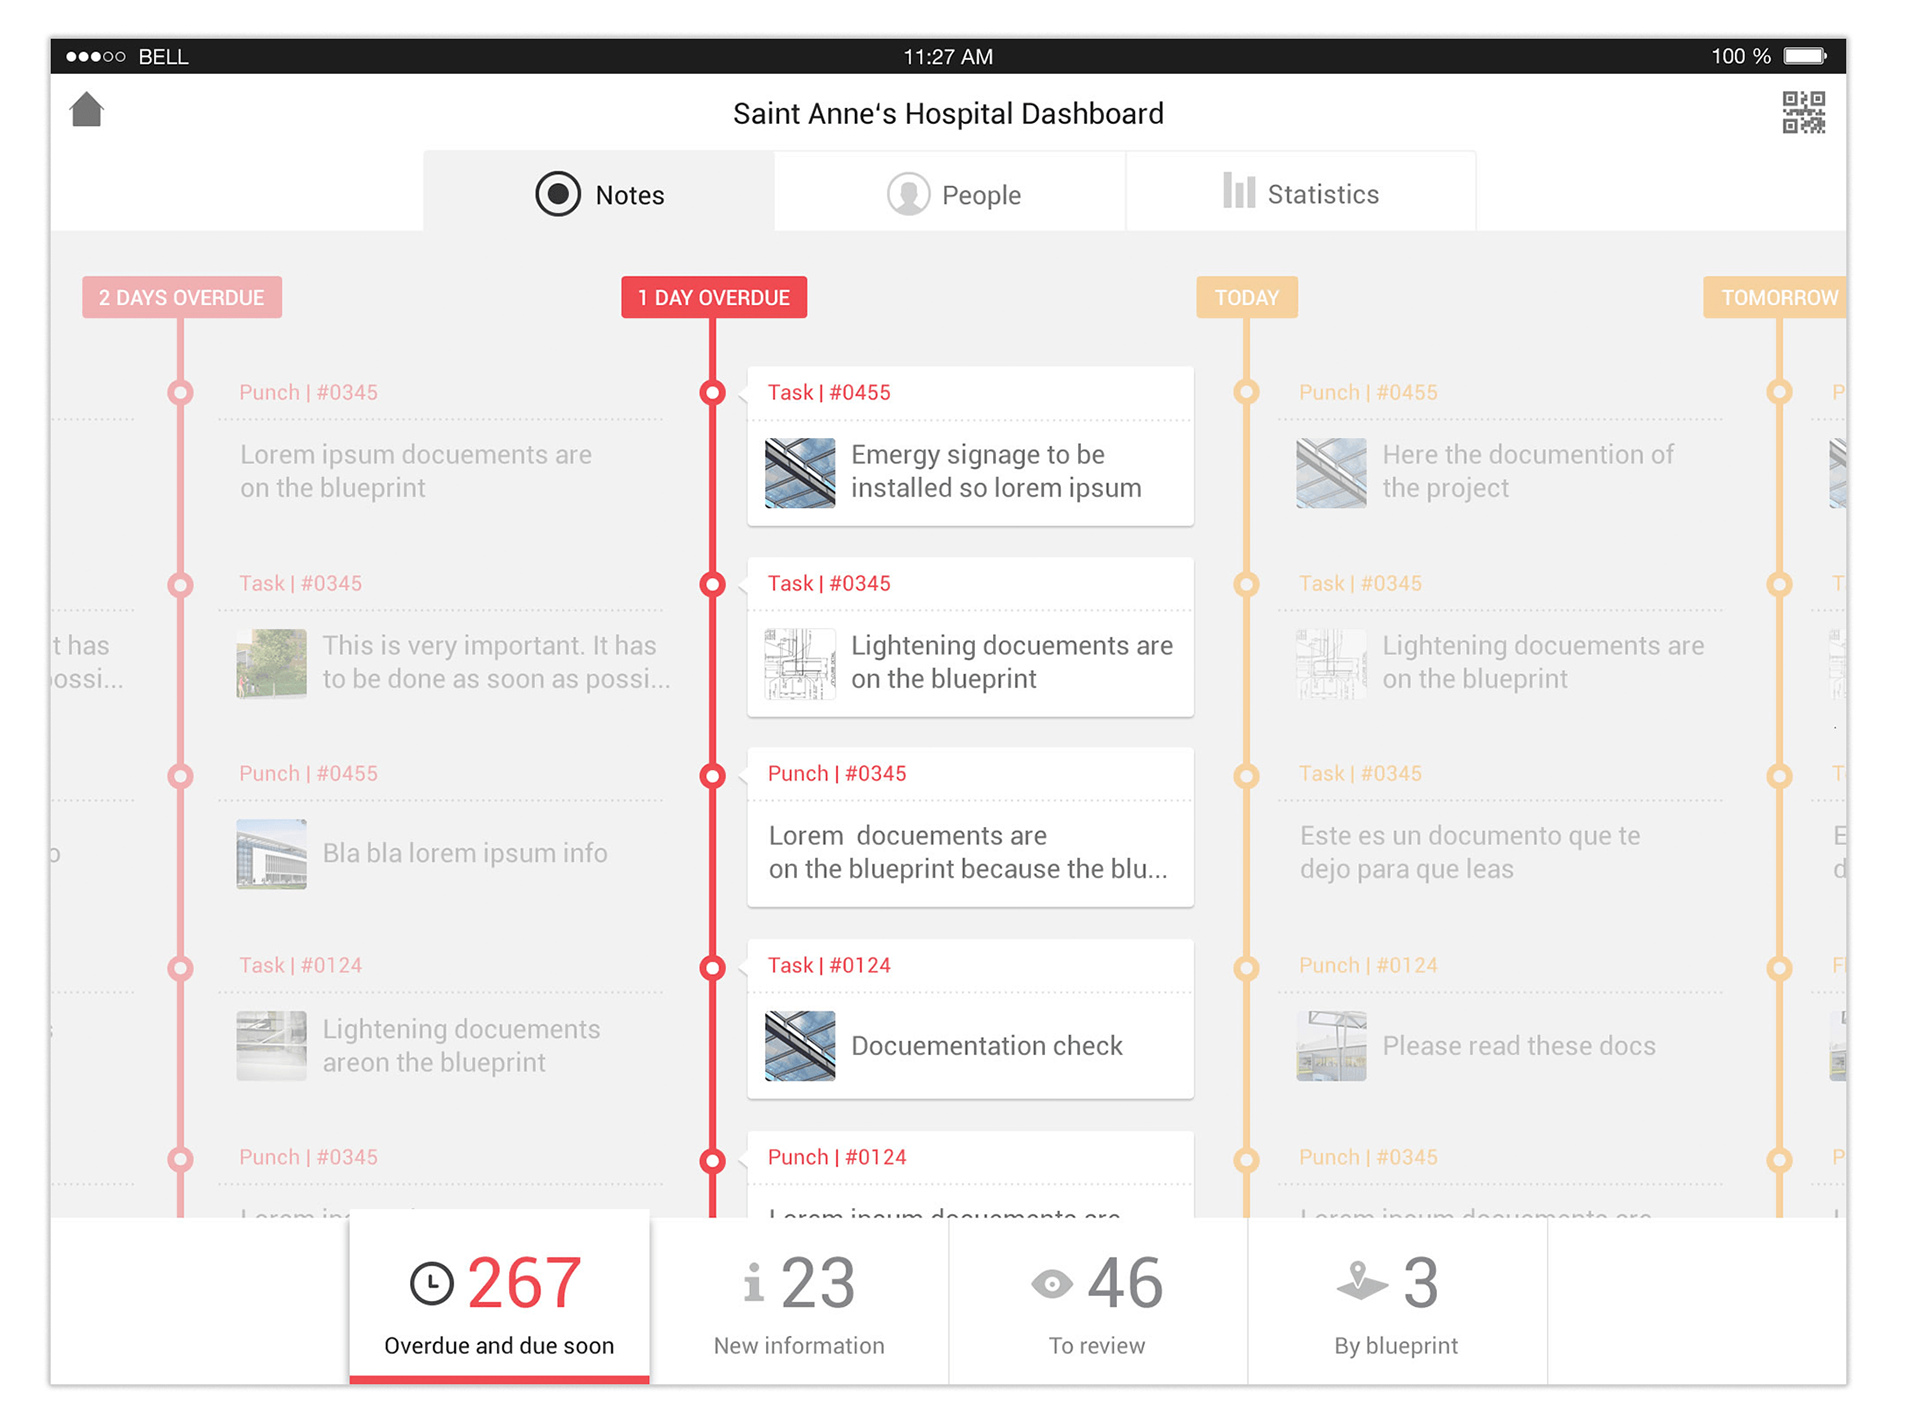
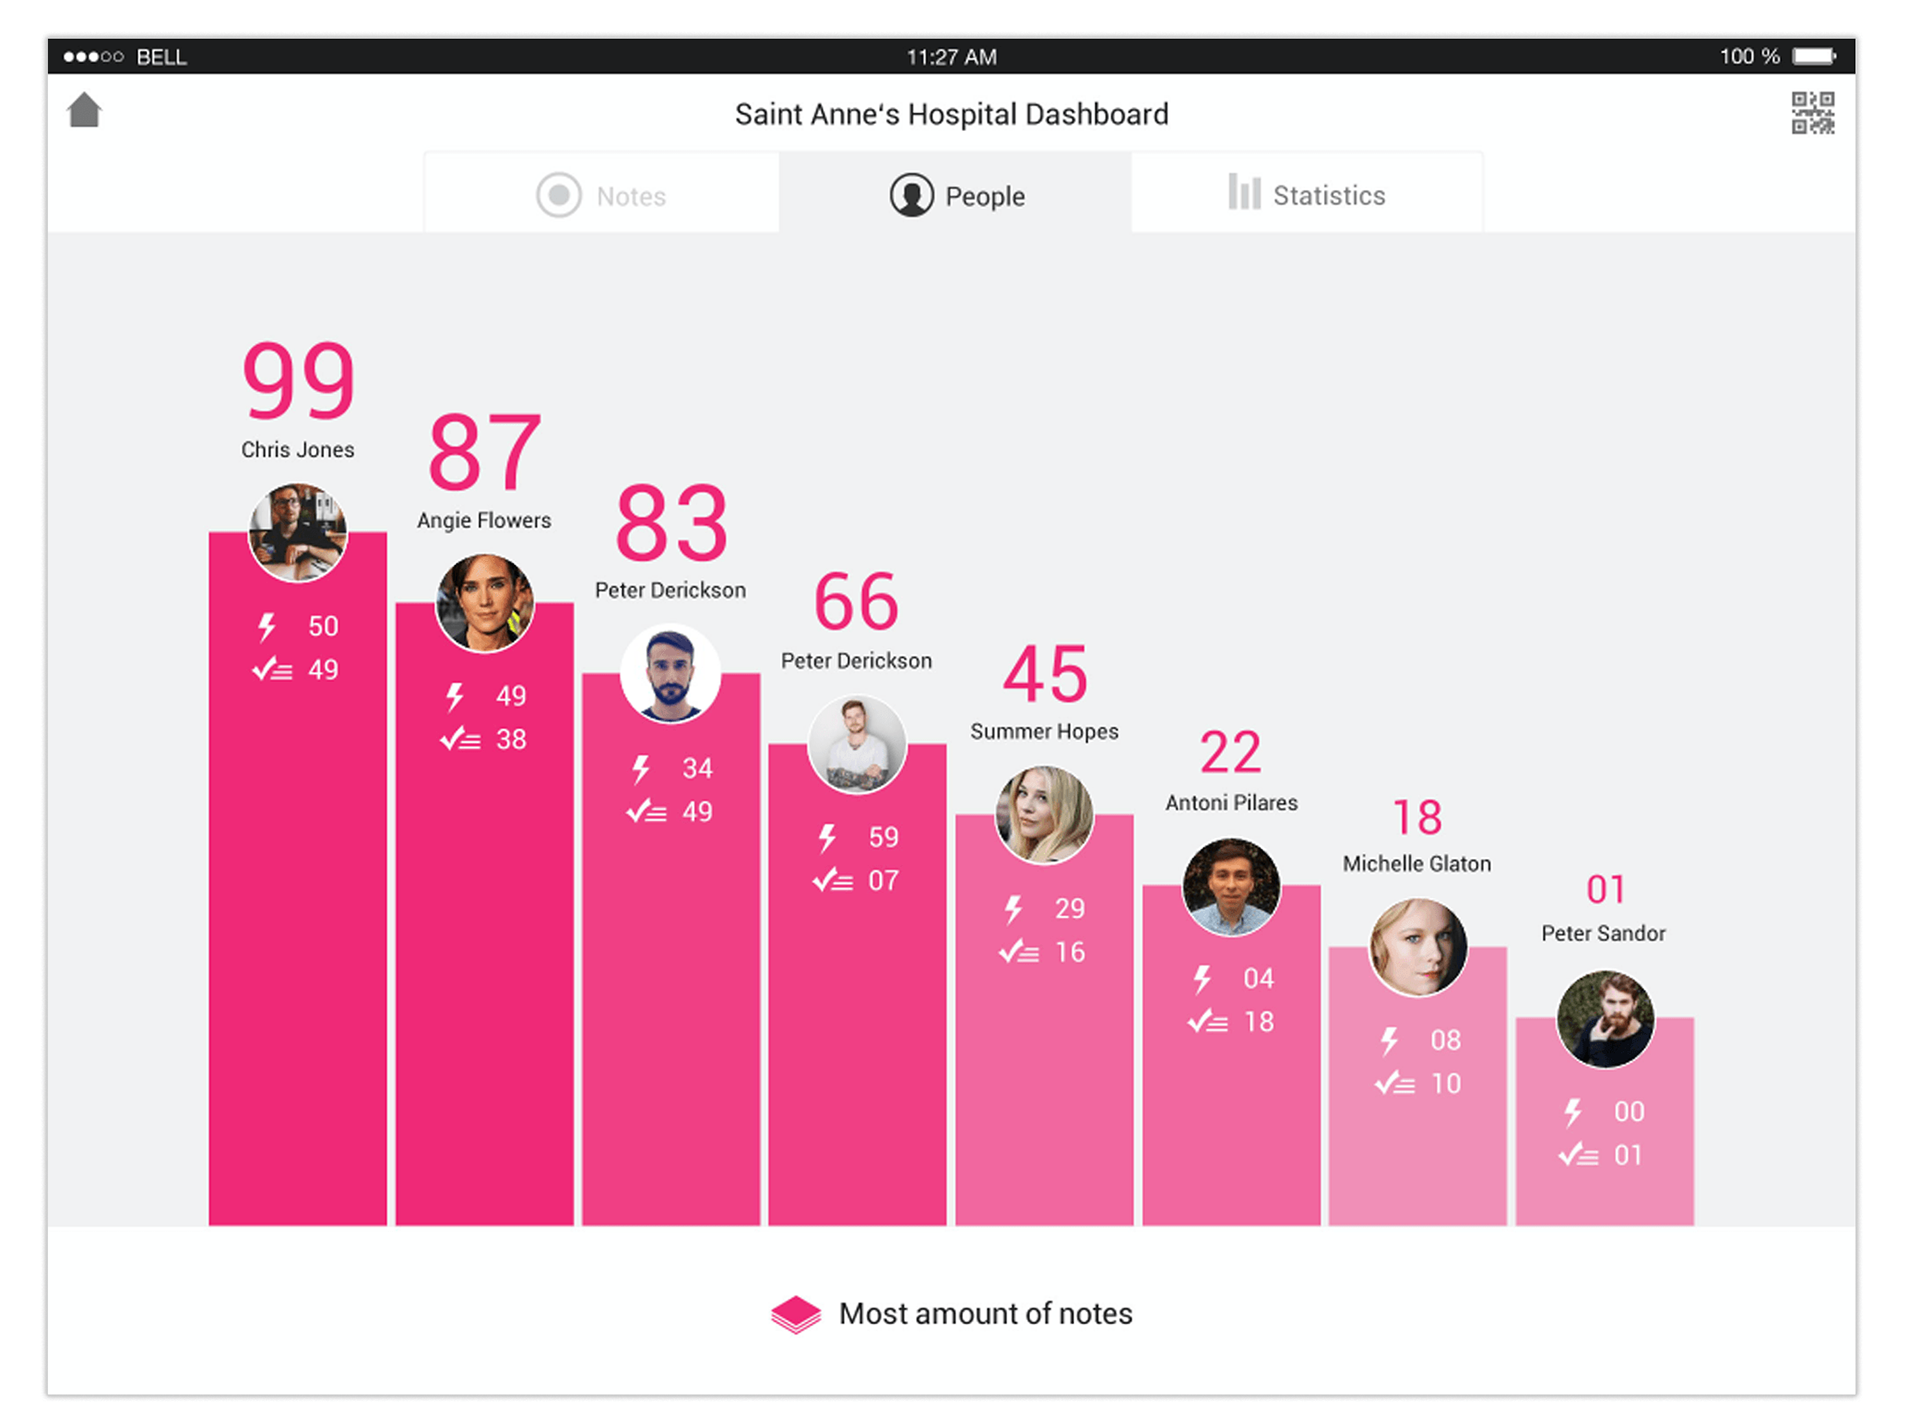
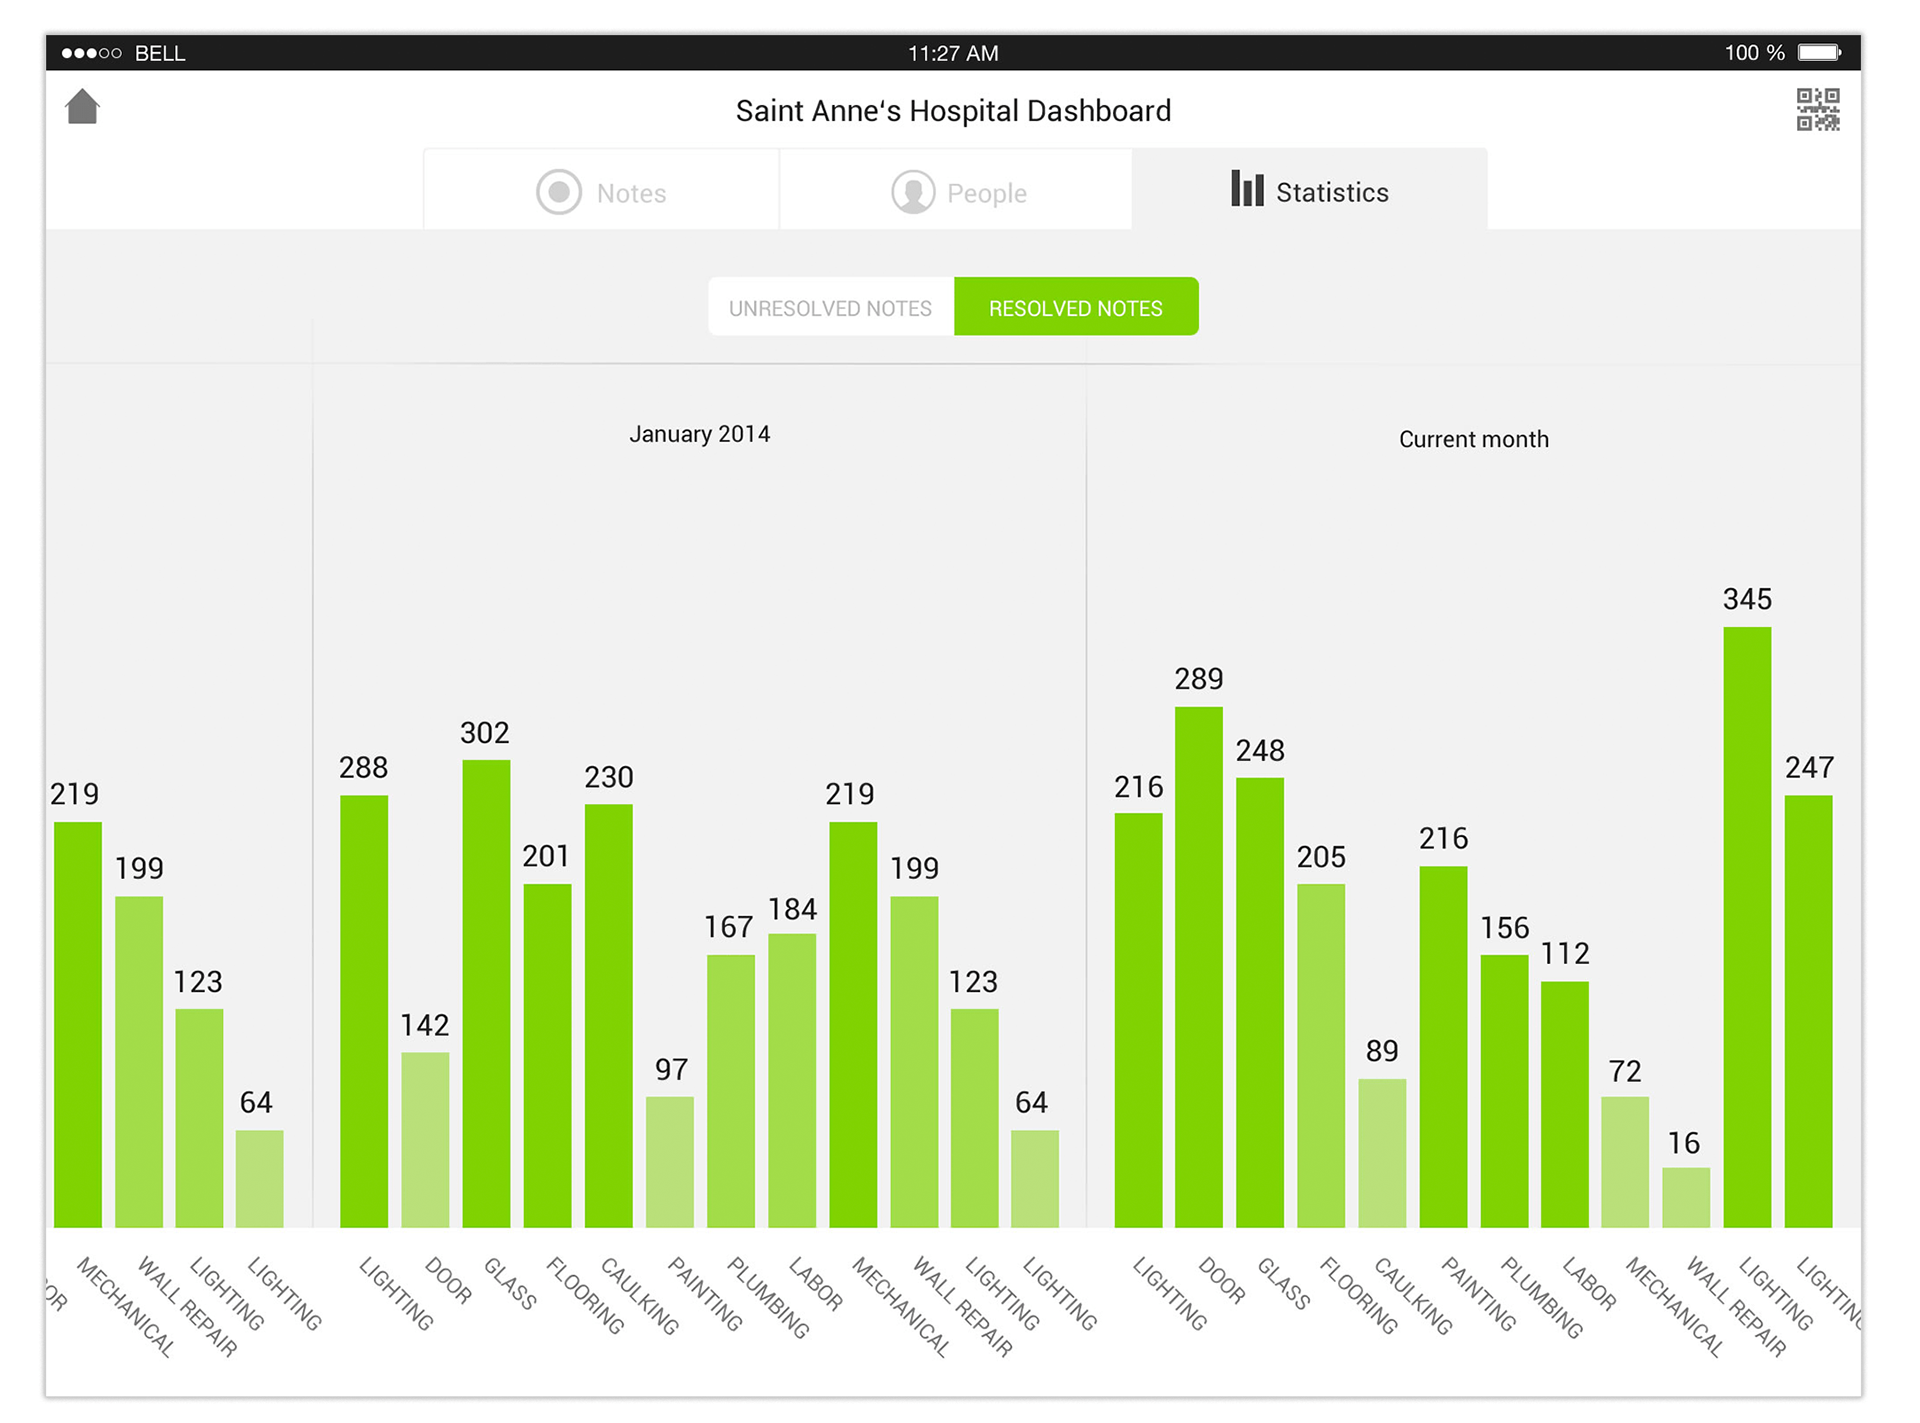
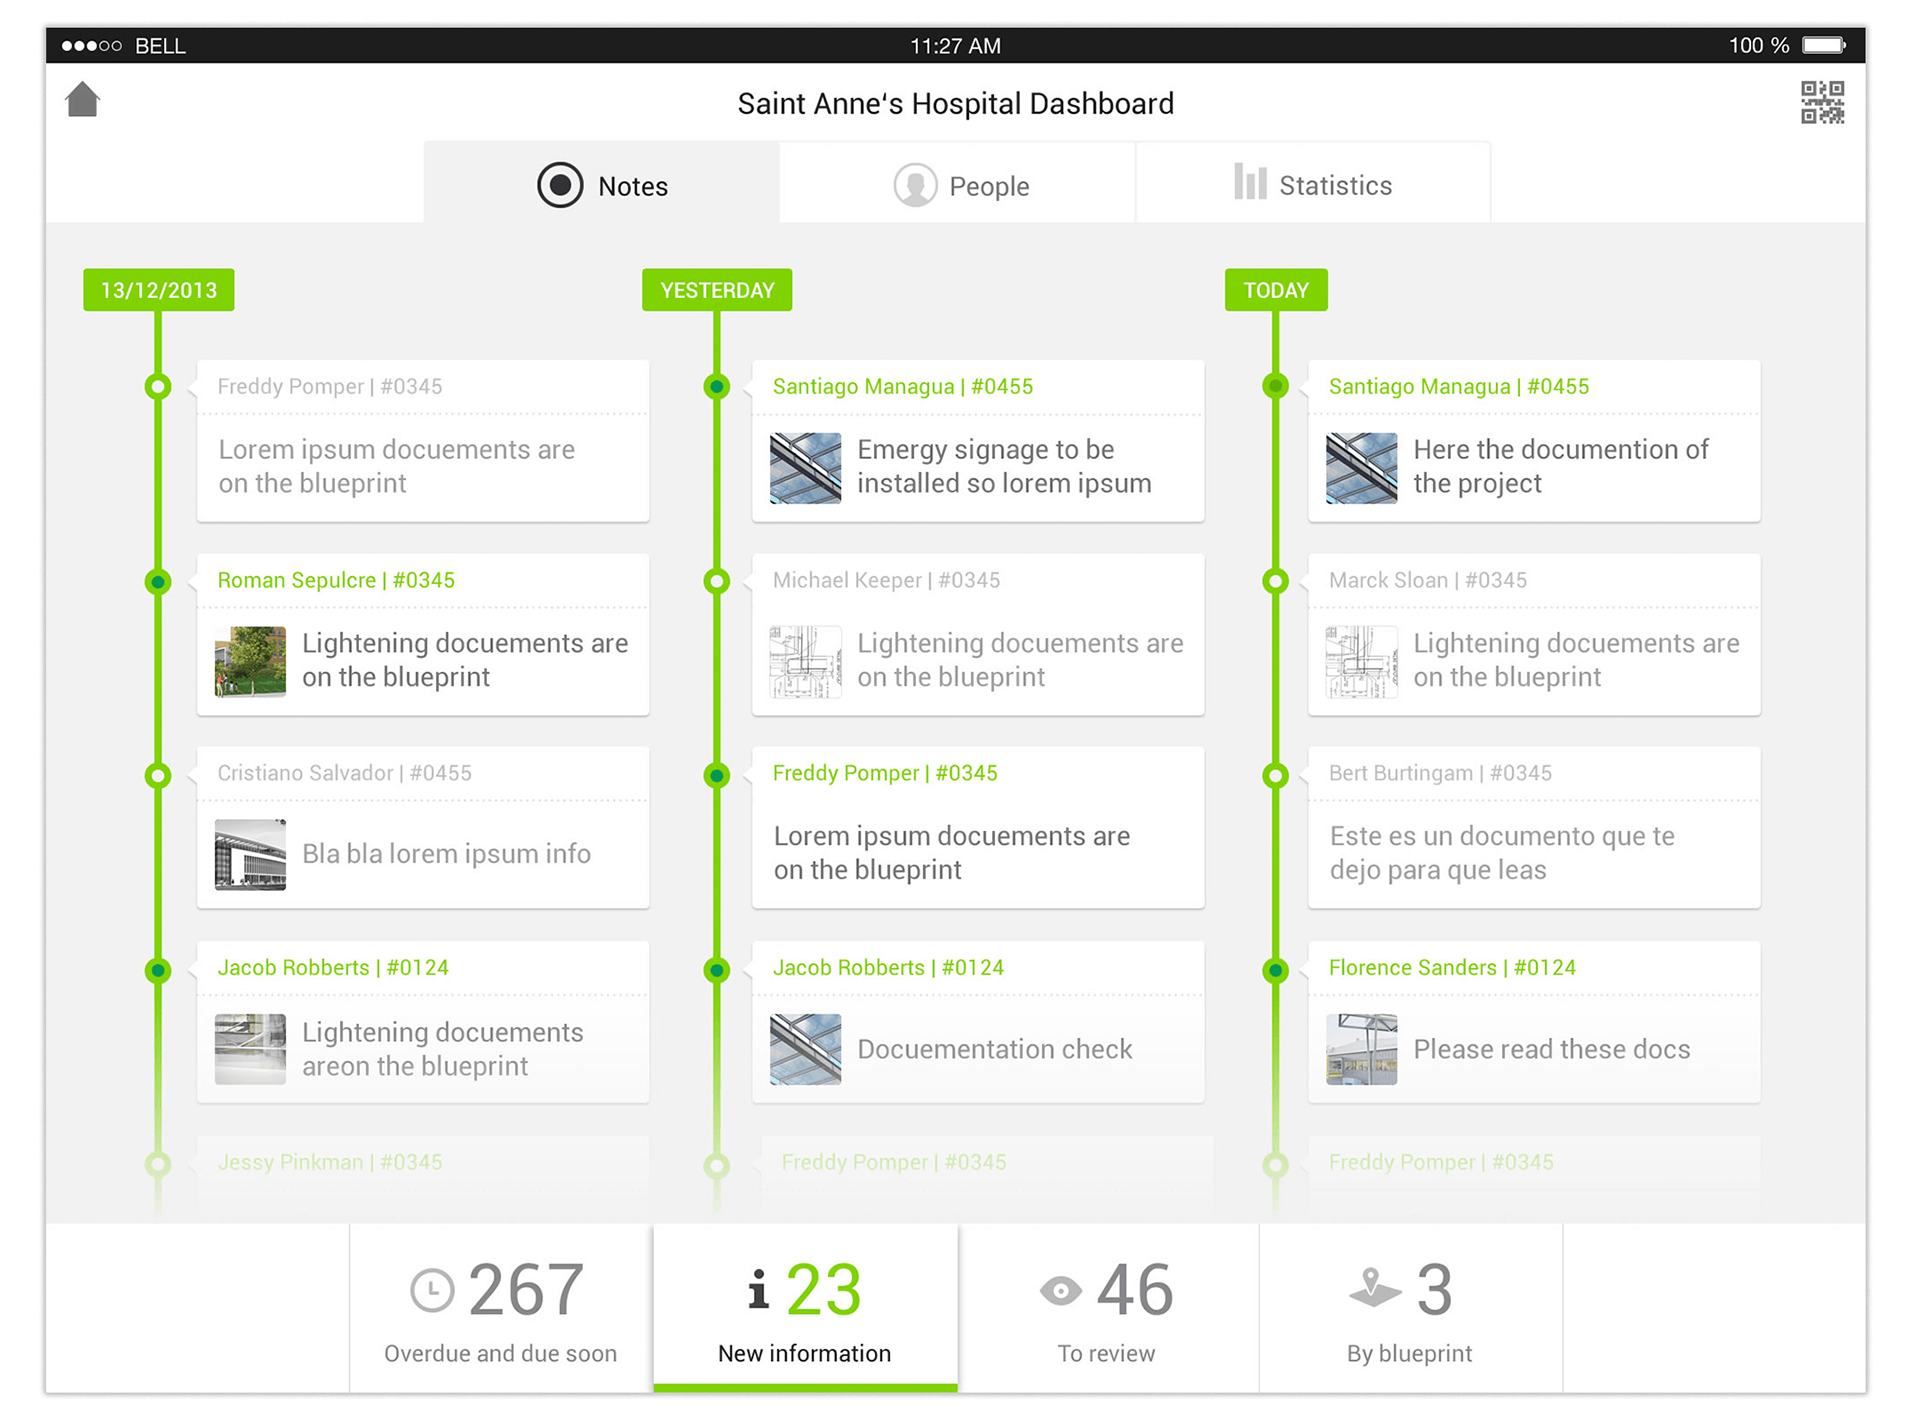
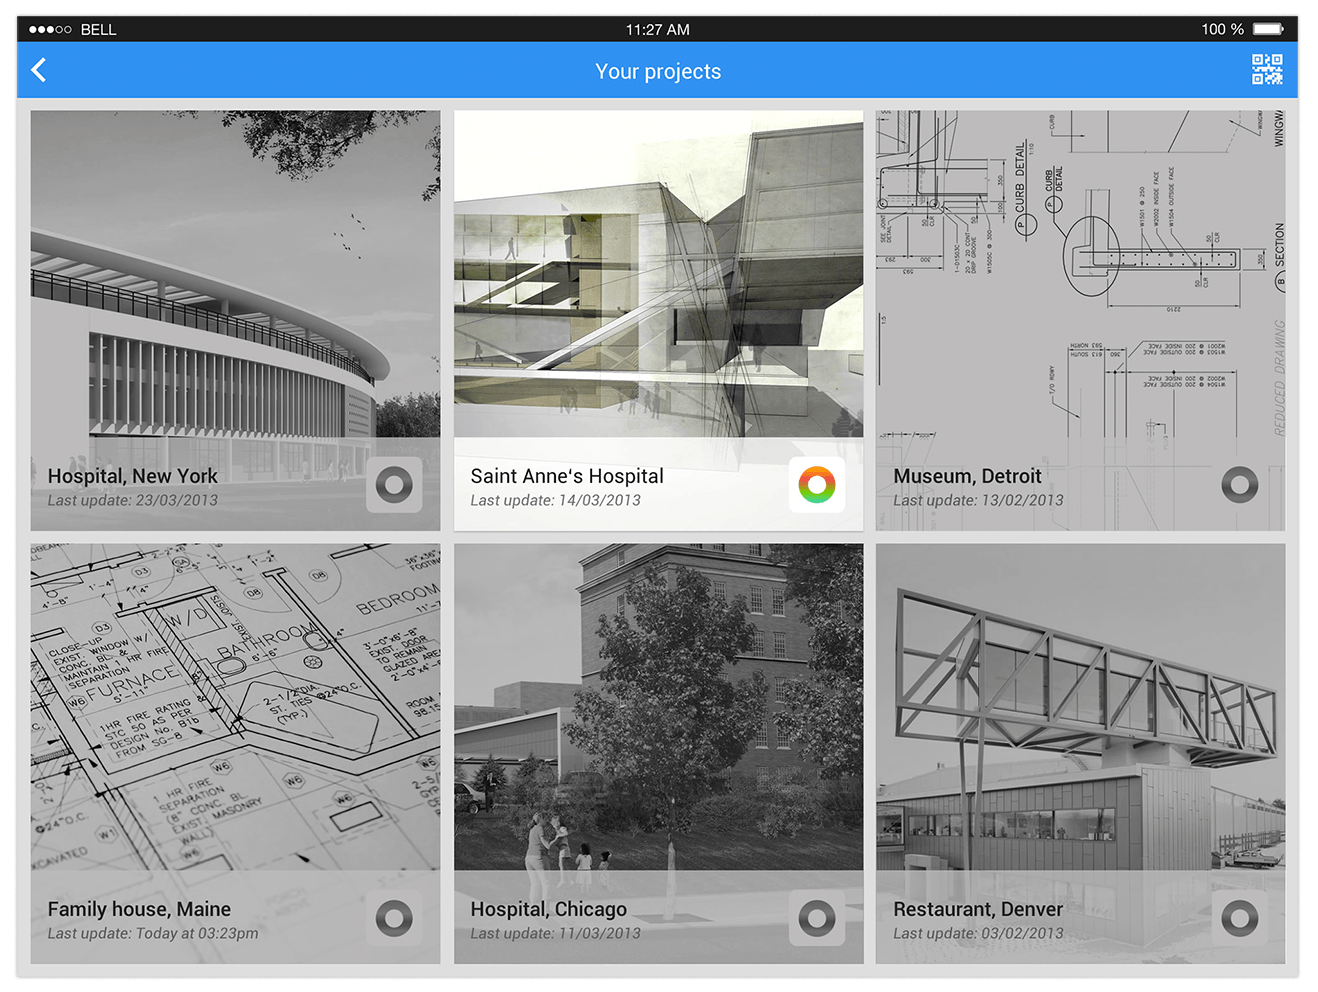
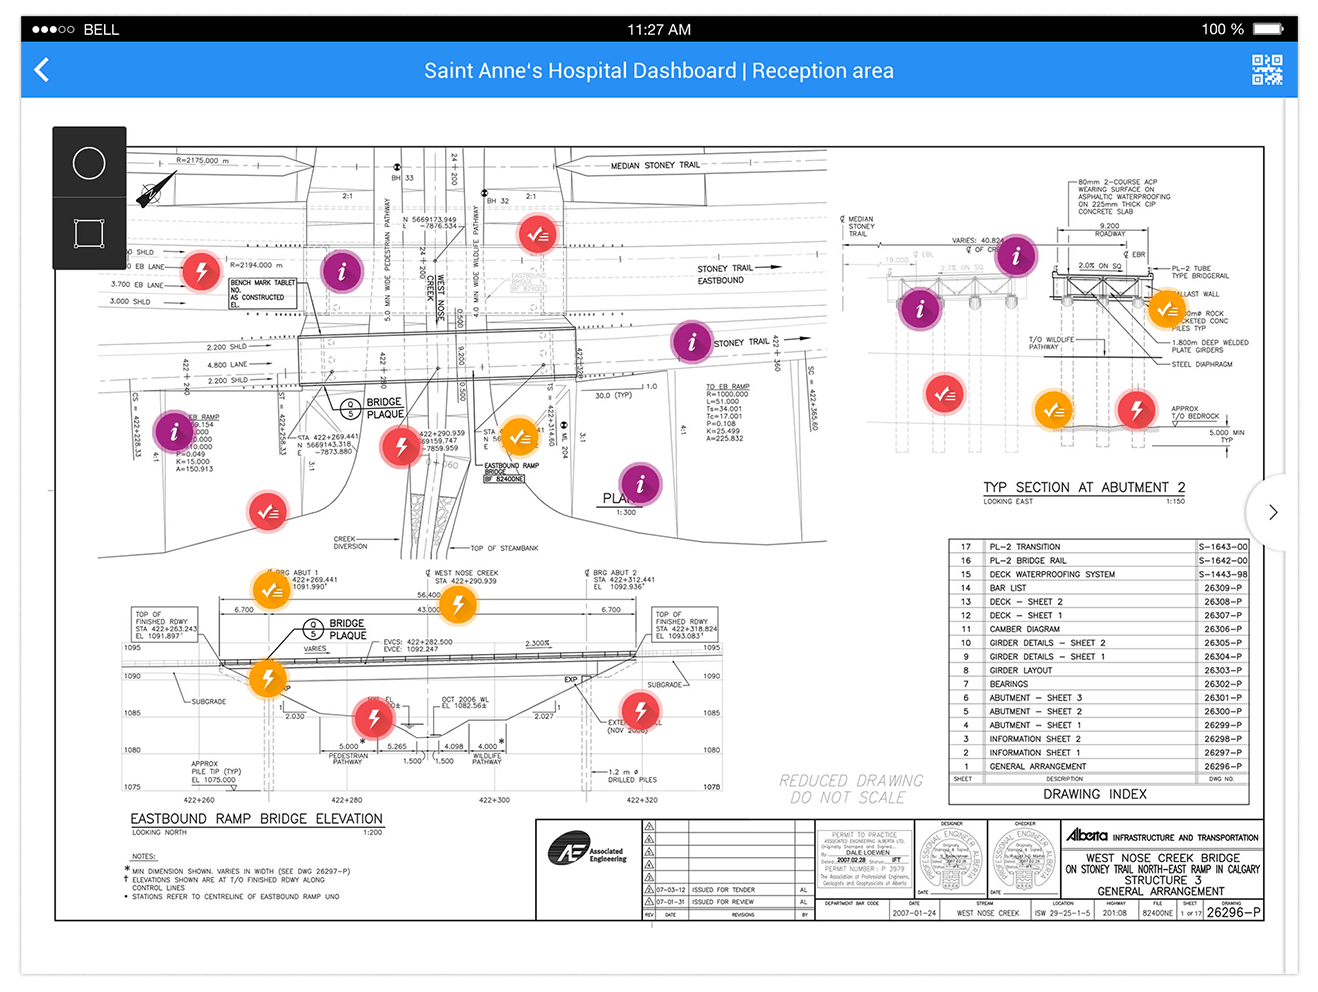
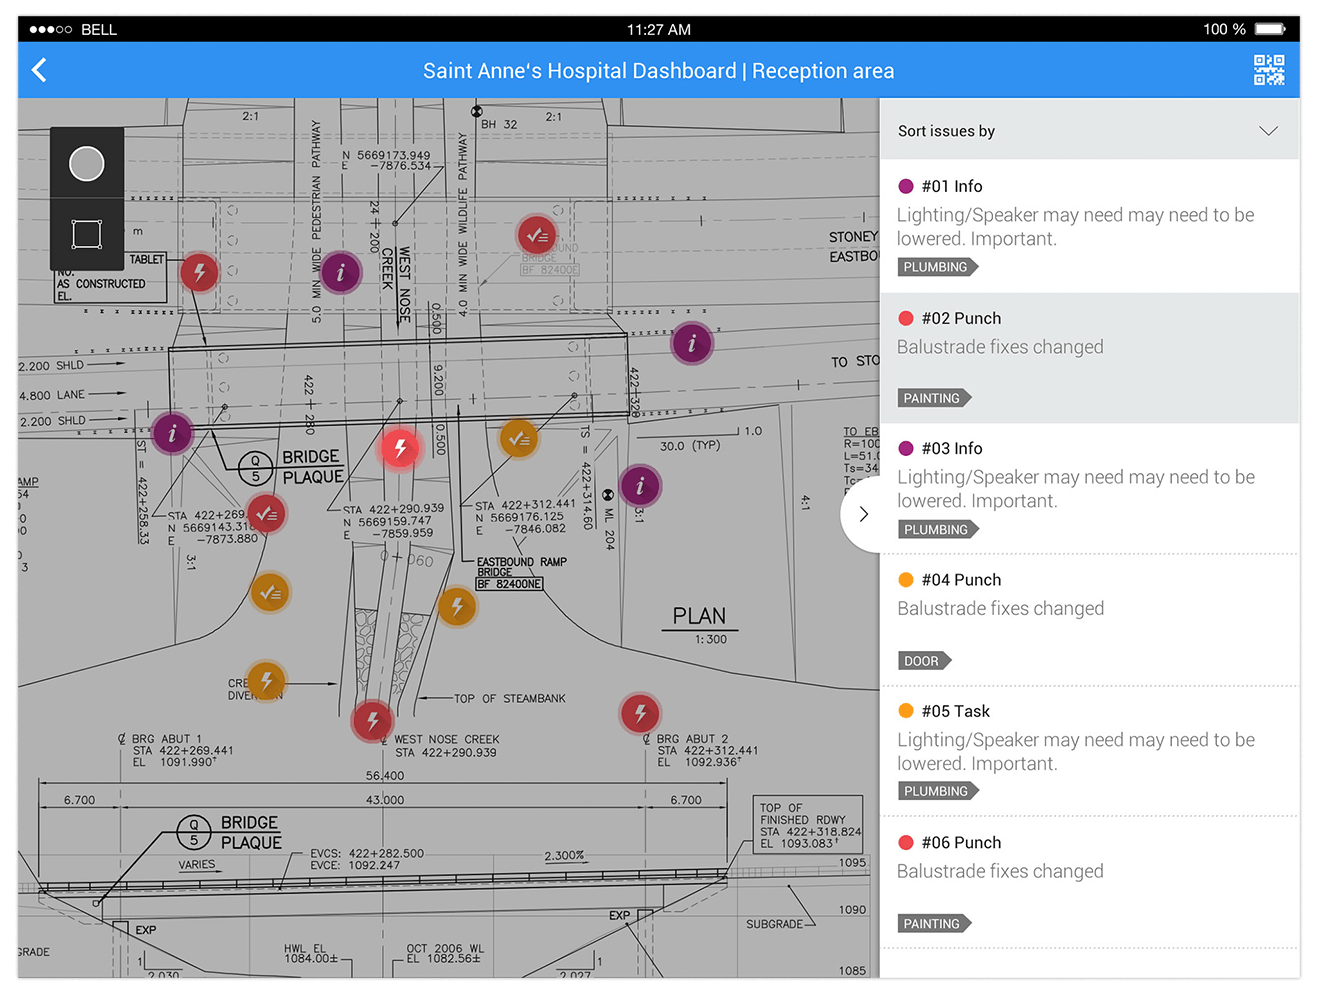
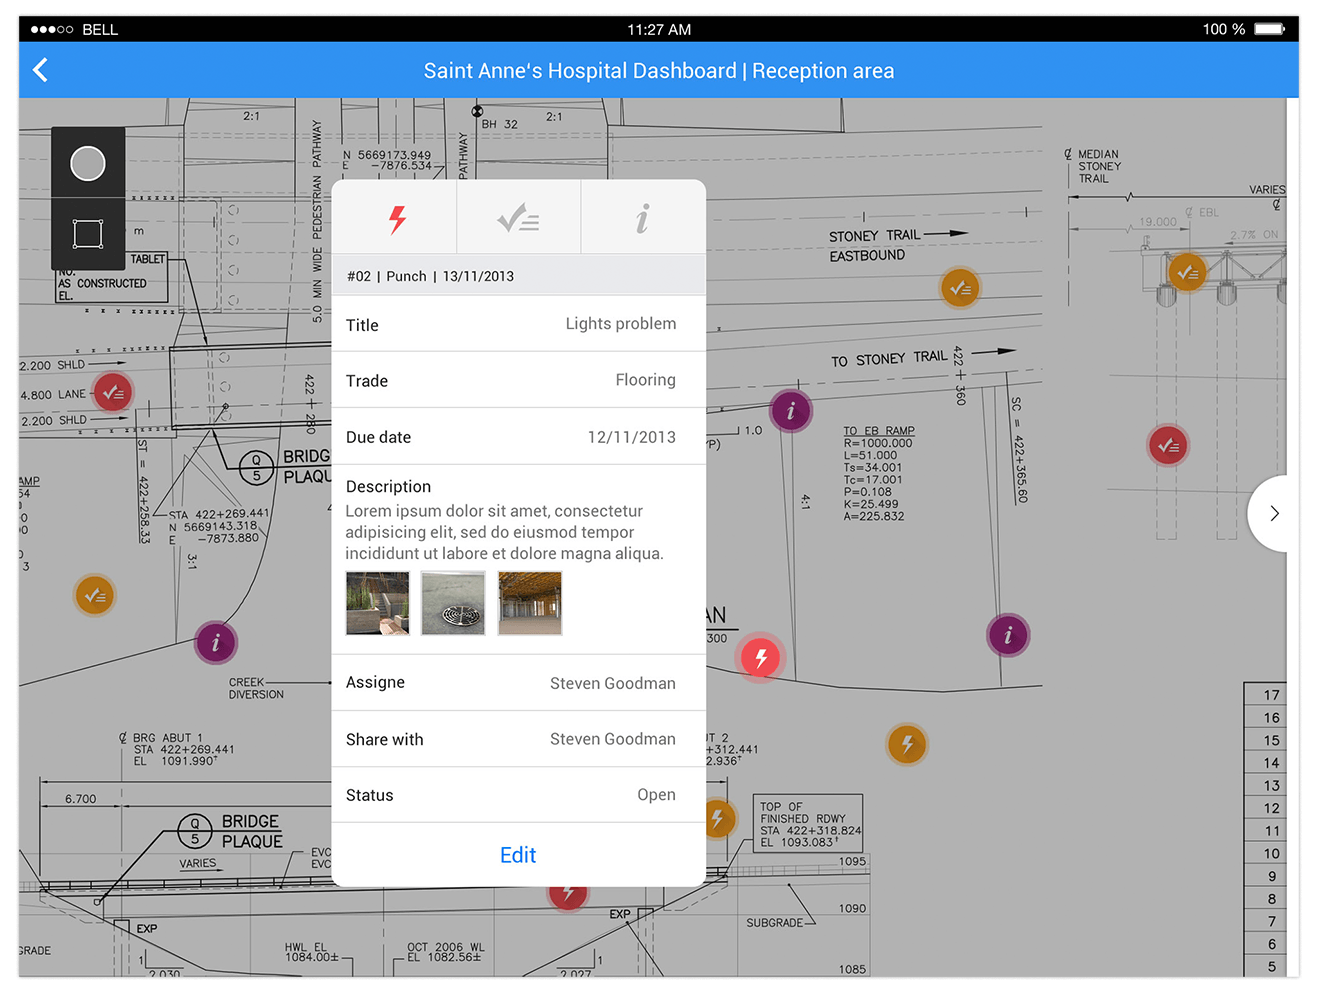
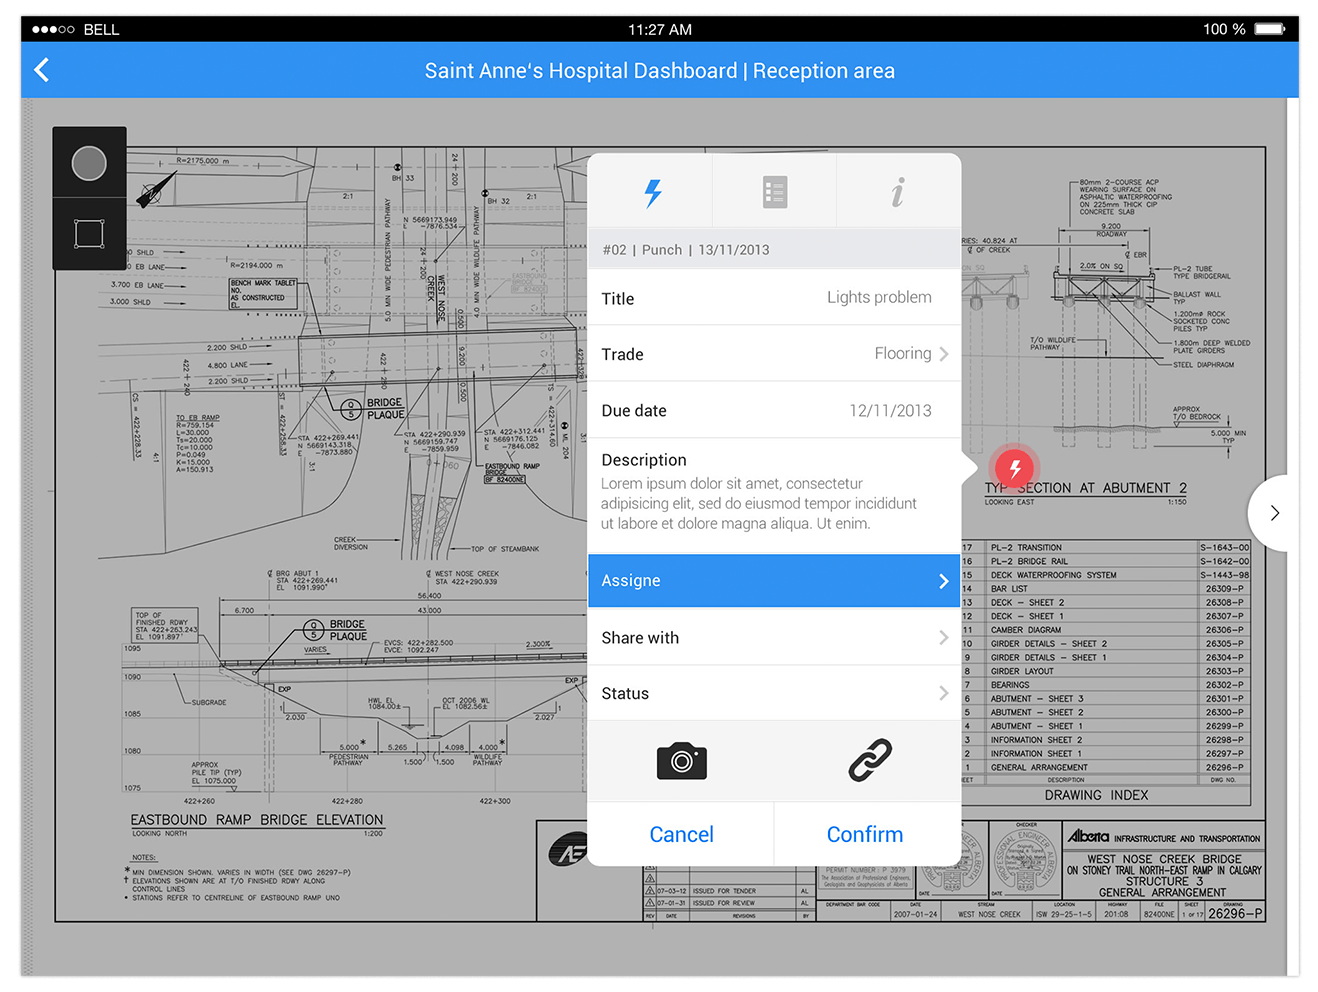
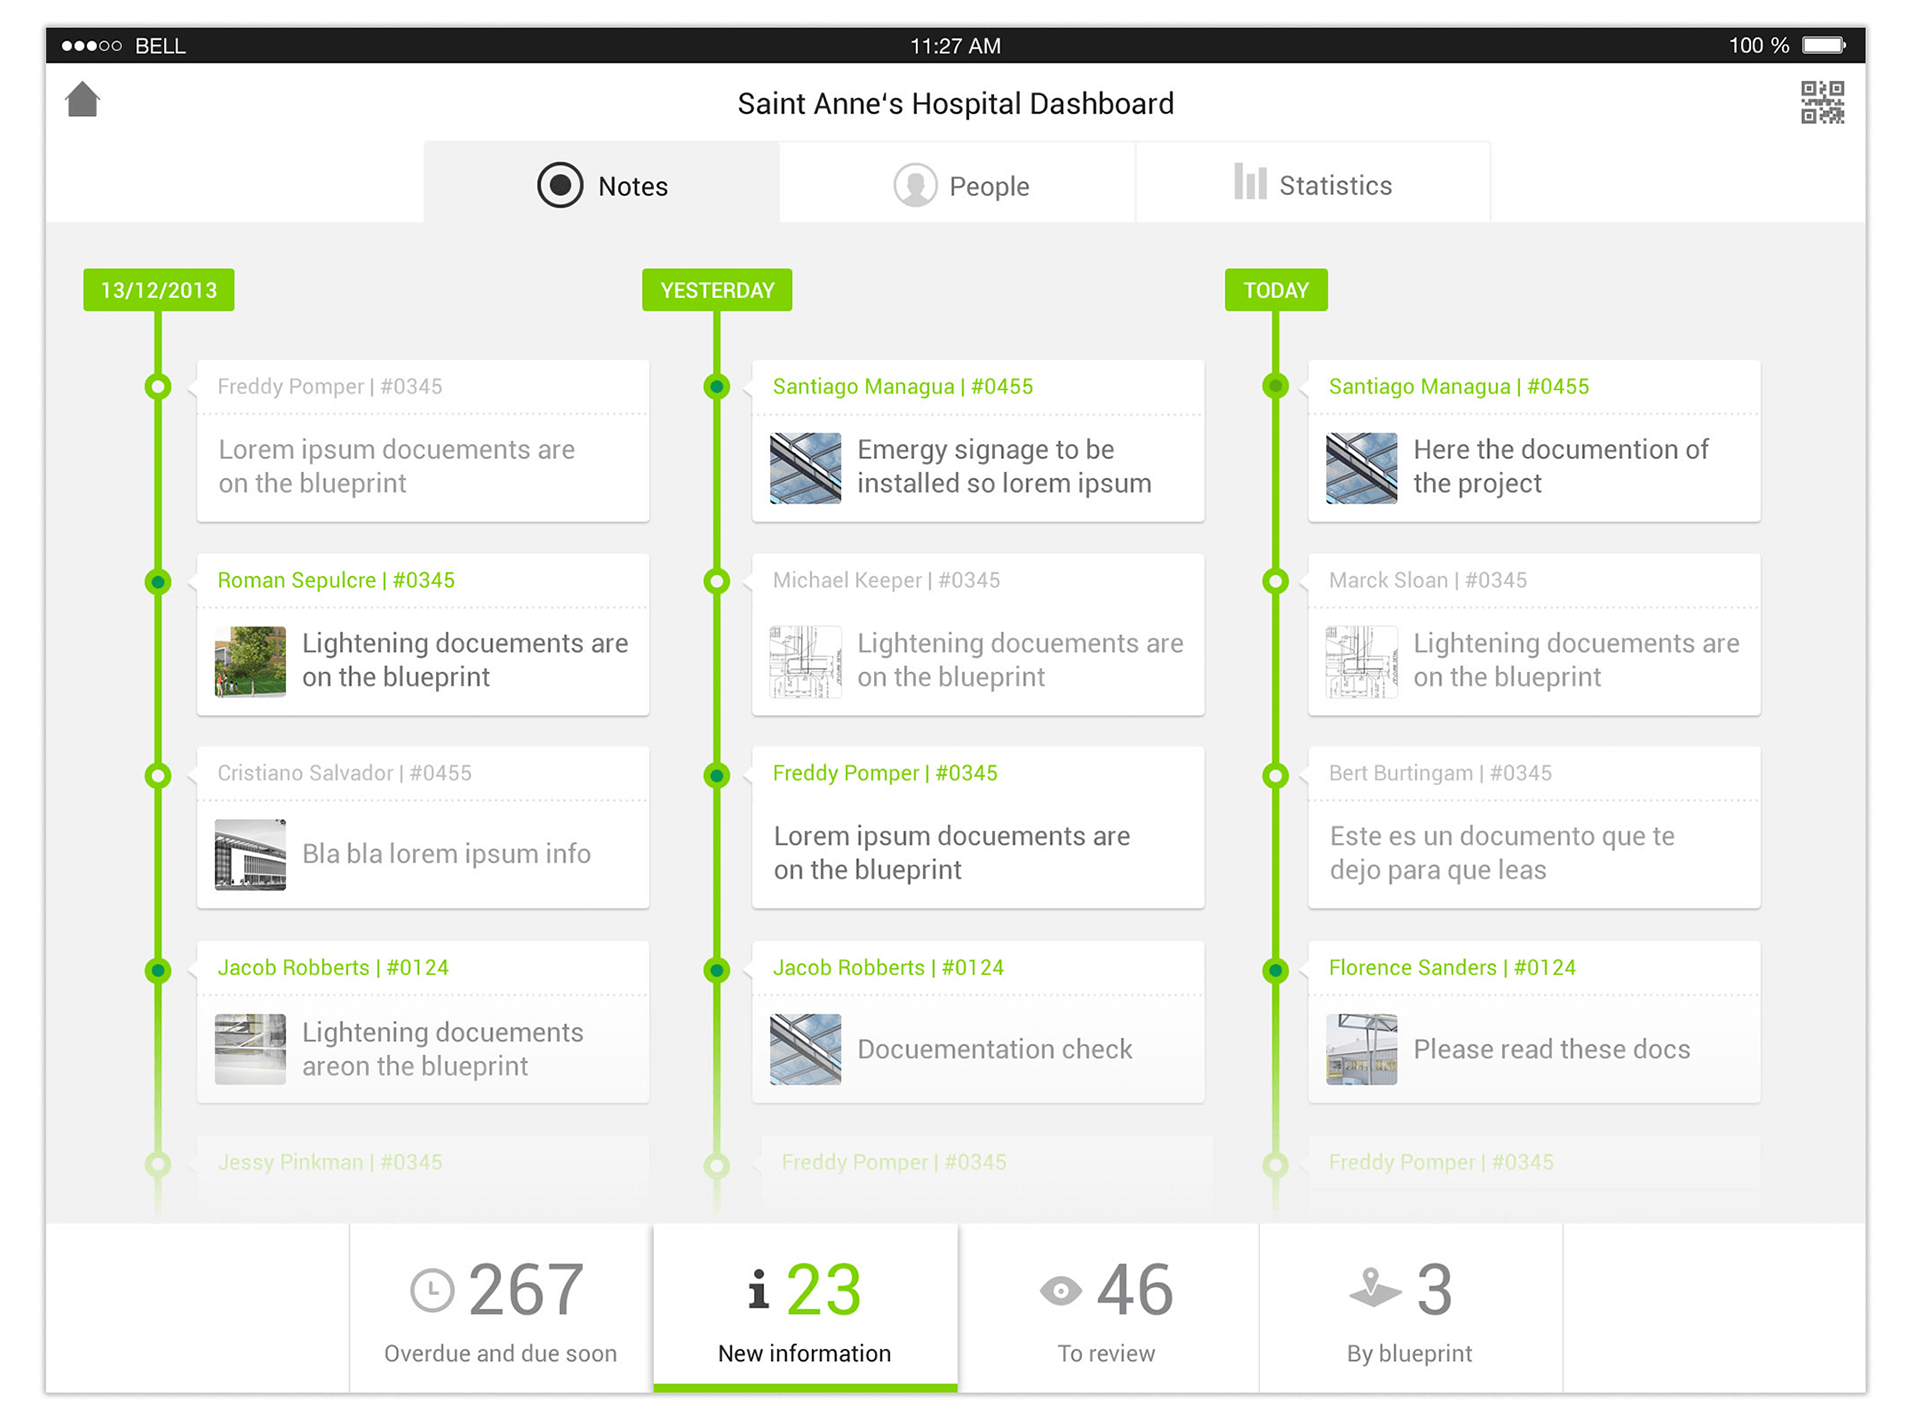
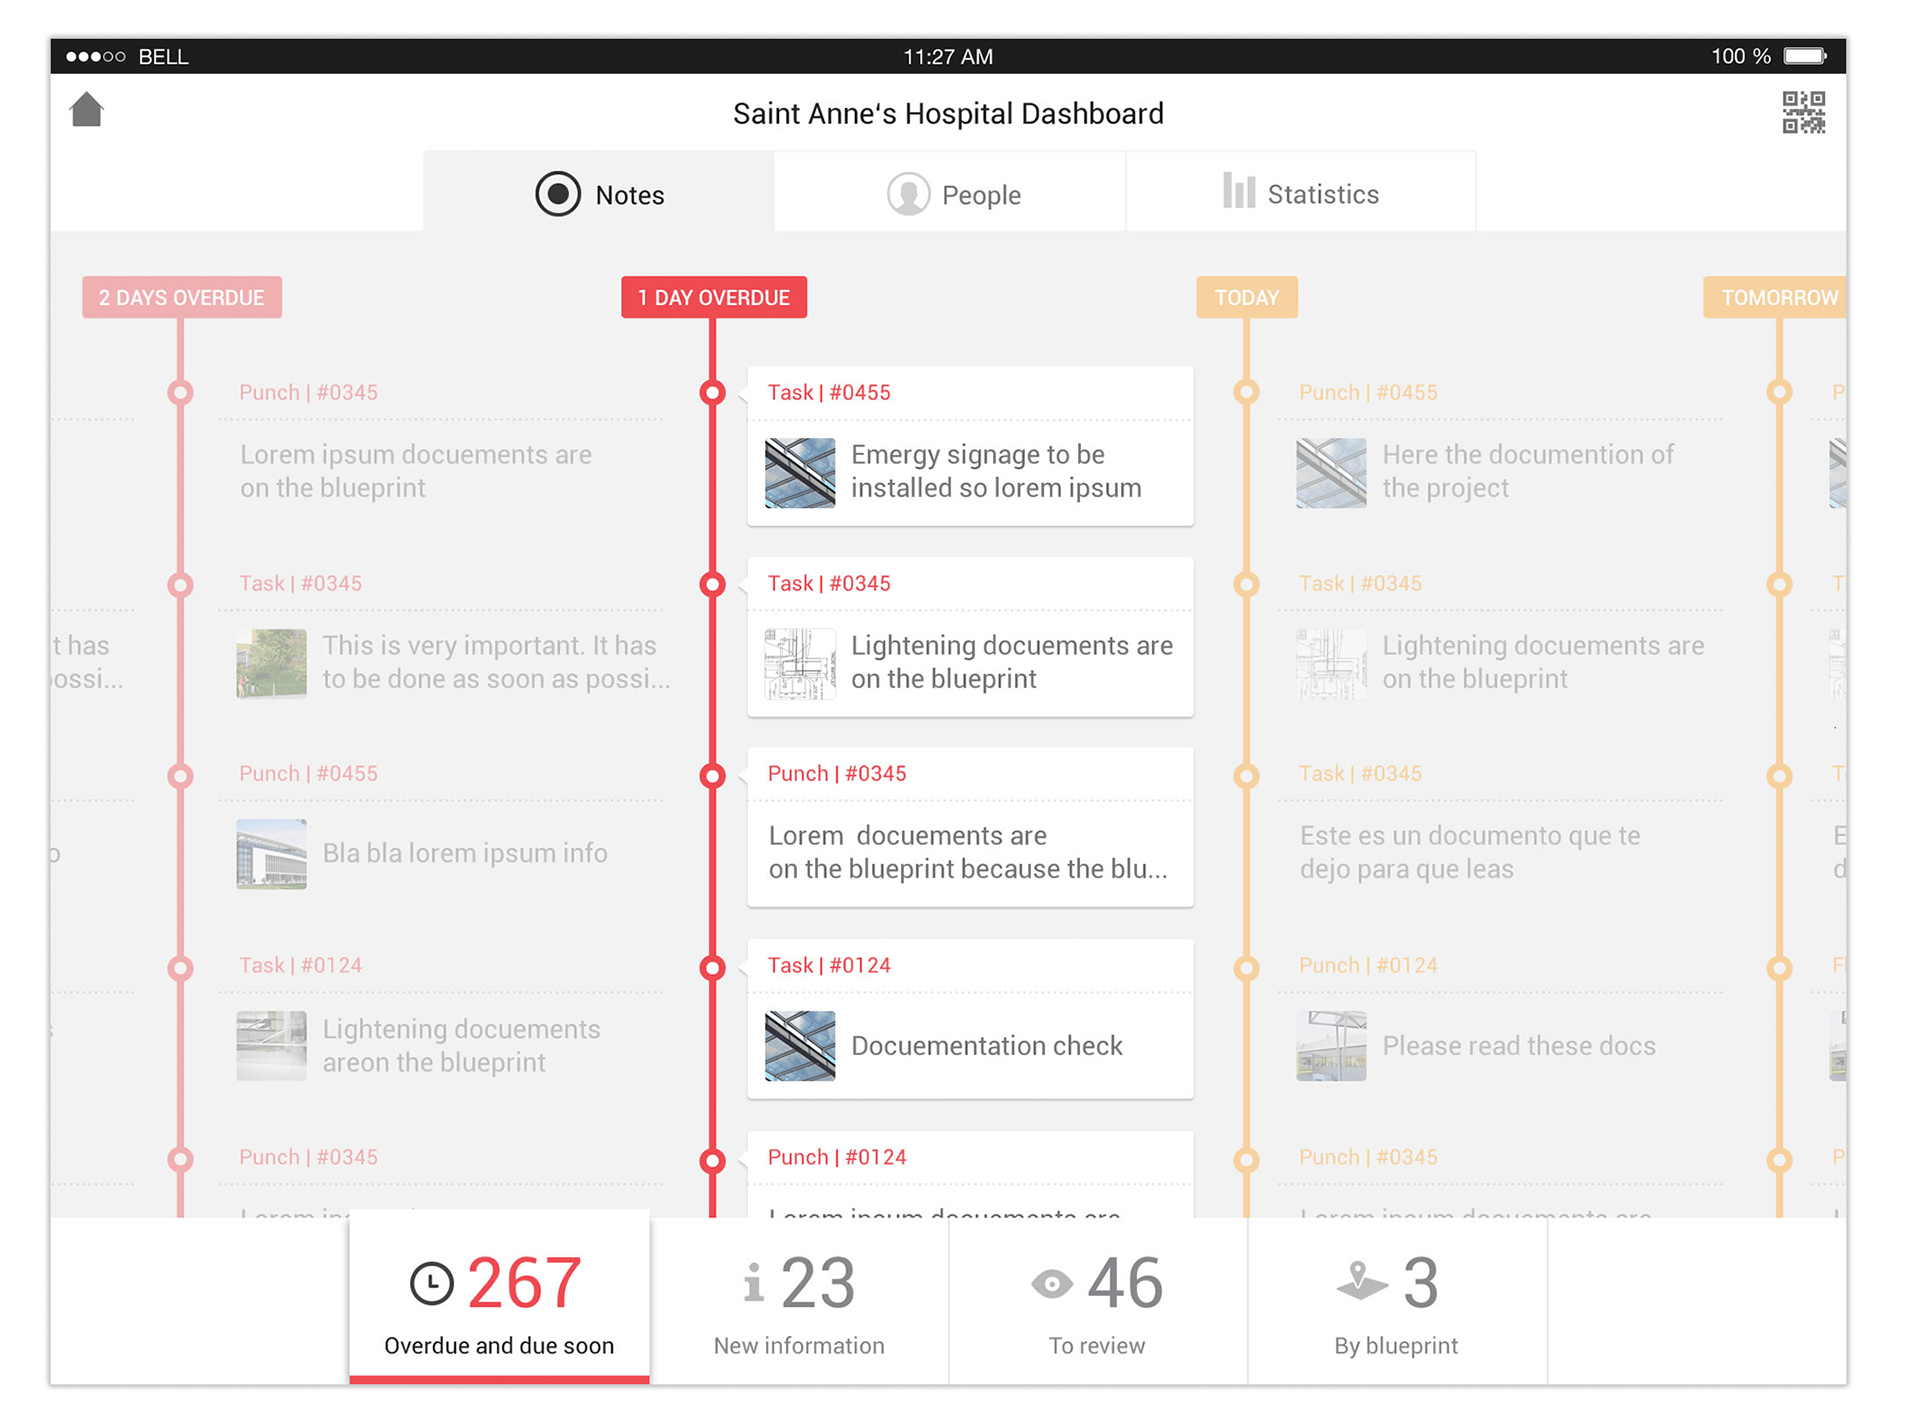
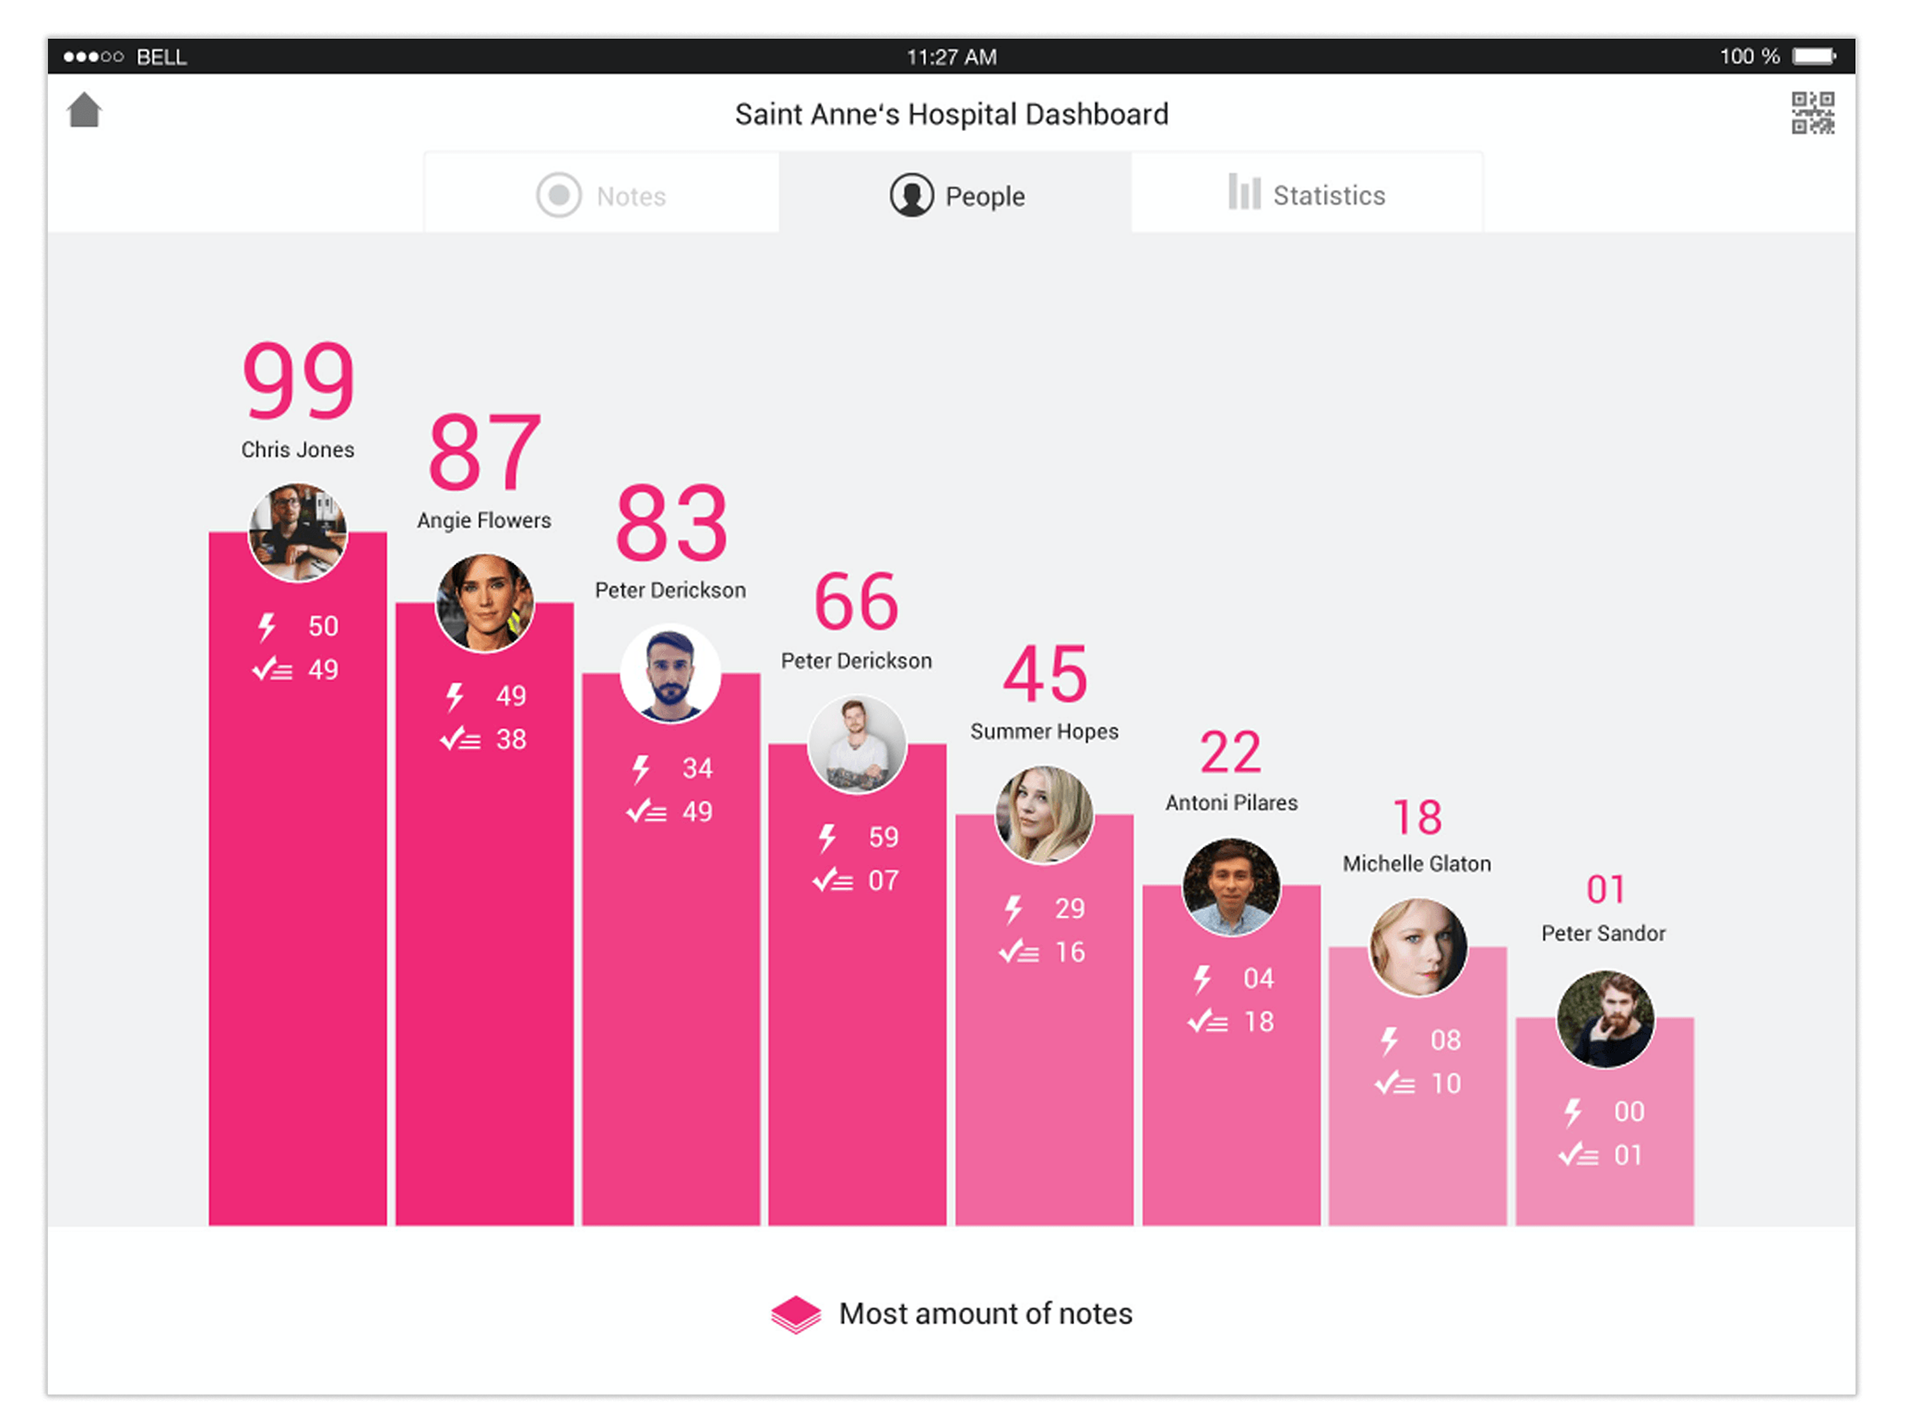
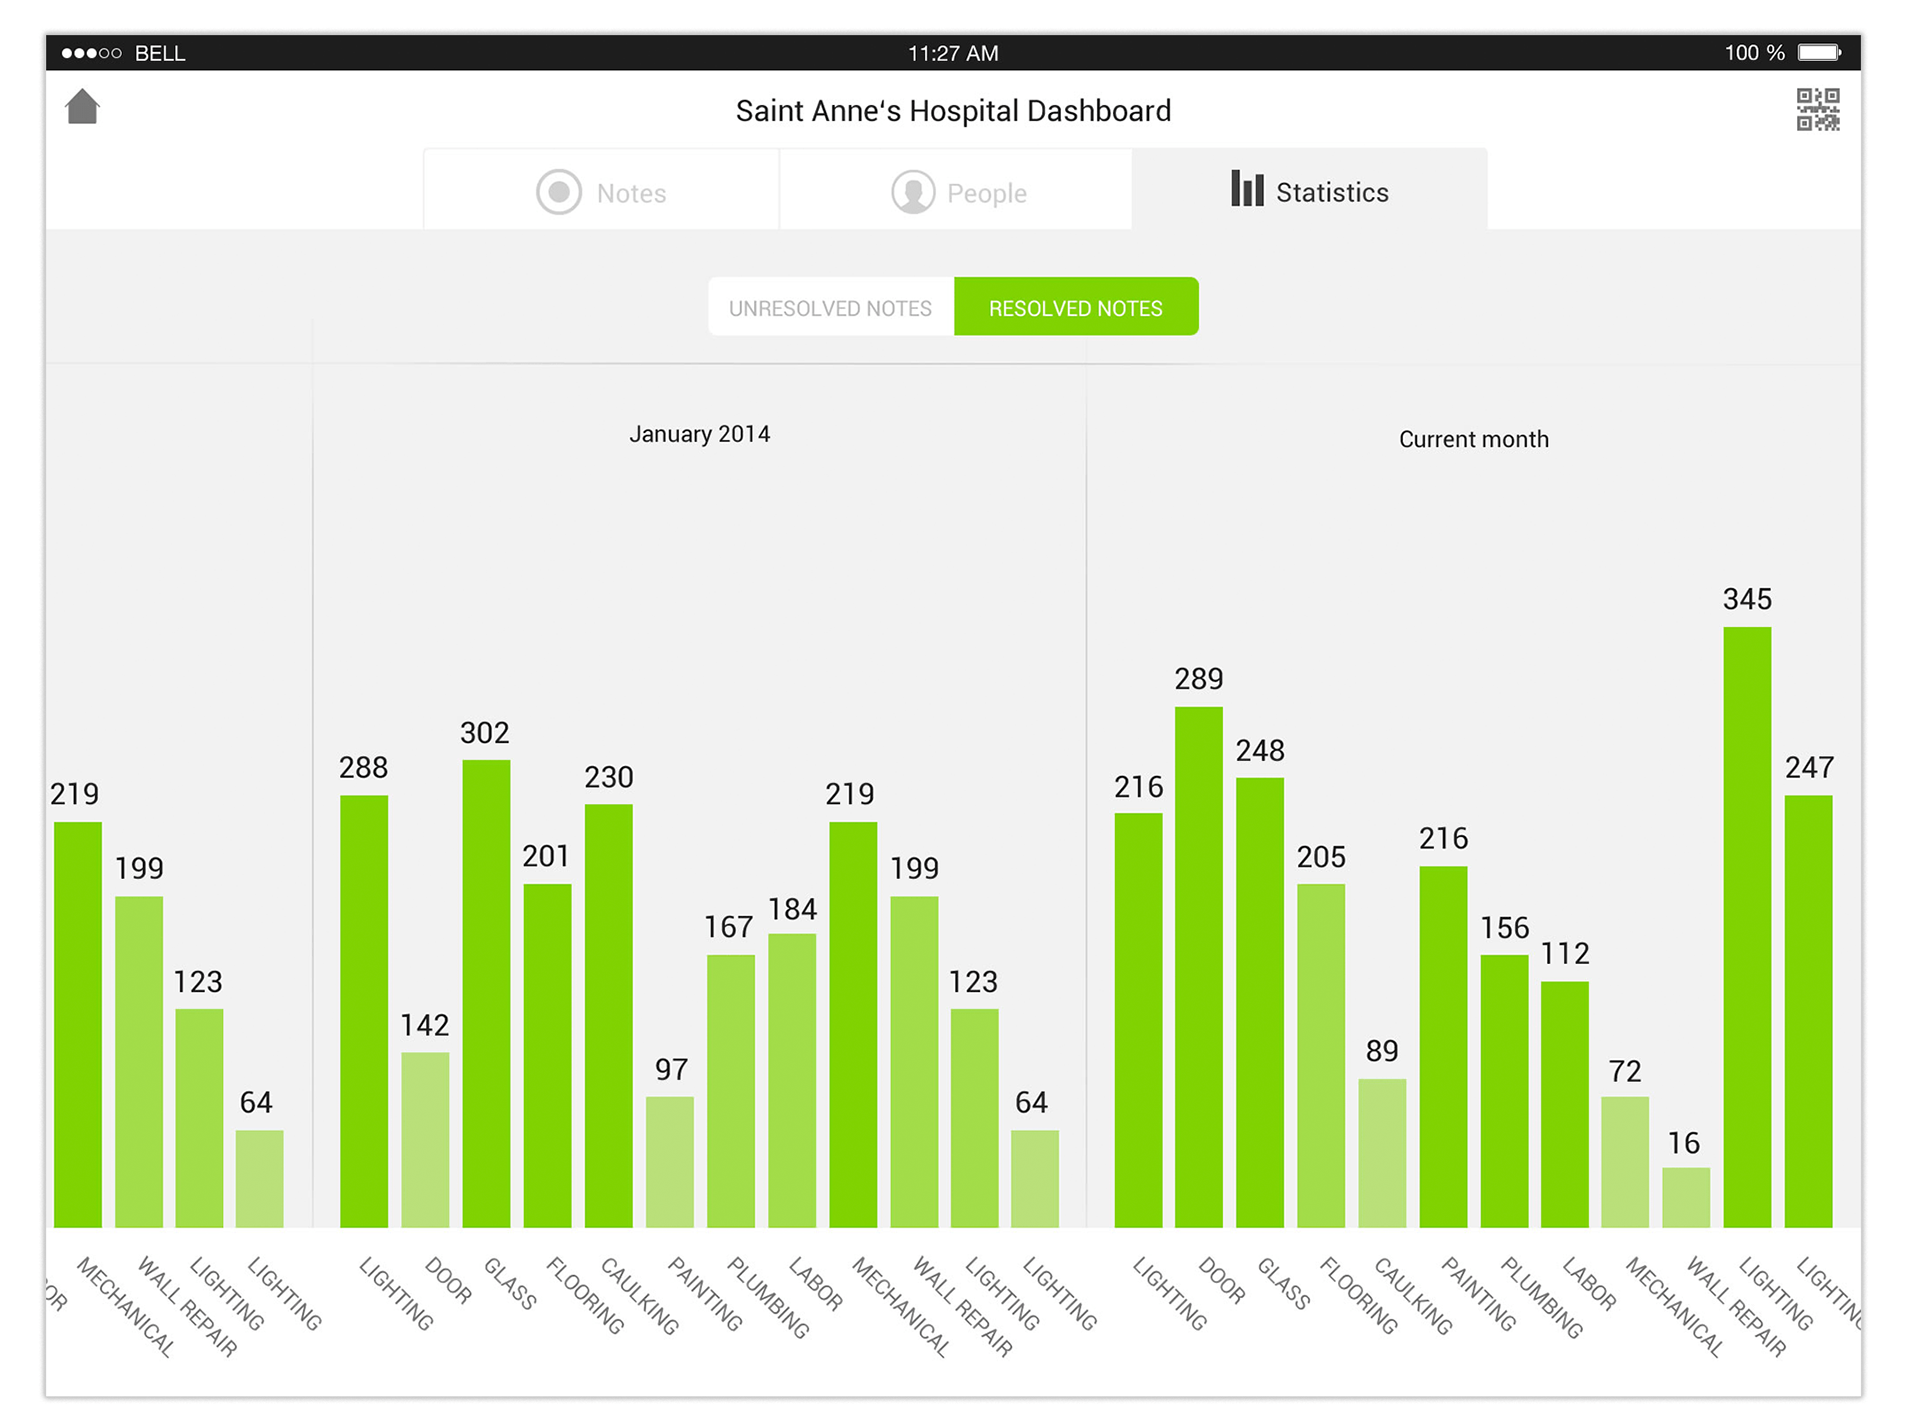
I supervised the general visual style direction and brand guidelines application throughout until delivery. Below are examples of the 2 major areas of the application: a) input area: where users can add and work on issues on a blueprint b) the dashboard view: dedicated to get a meaningful overview of the overall state of the project and an understanding of the most urgent problems.
______________________________________
